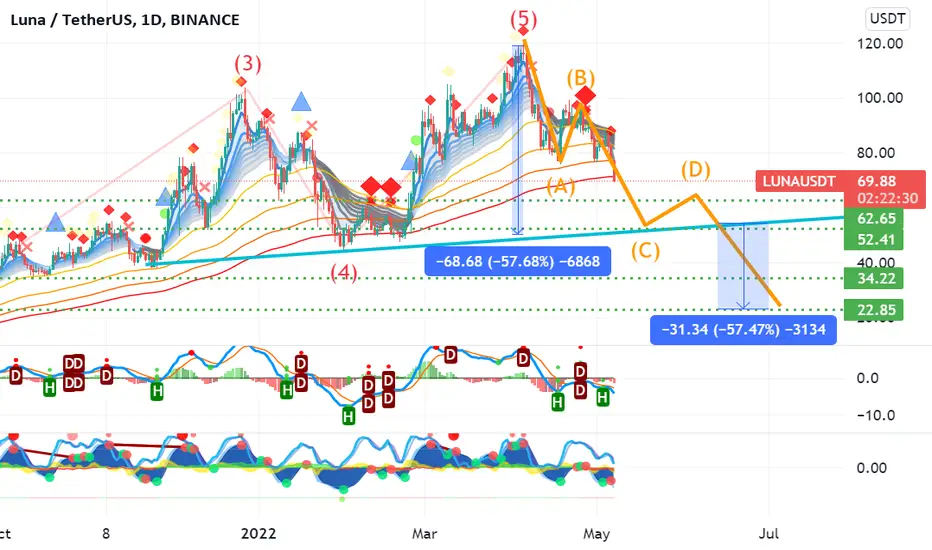
This chart based off of The Elliot Wave Theory, Head/Shoulders pattern, Fibonacci, MacD, RSI, Momentum, and resistance/support zones. In my opinion, wave 5 topped off and we are now entering a A,B,C,D,E correction. We have all indicators turning to the downside. We just fell below the 200 EMA which means it’s not time to buy yet. Wave C will take us down to the neckline (trend line) where we could see a small bounce there up to wave D. I see the neckline break of wave E taking us down to the $22 zone. The height of the head/shoulders is calling for this target as well. We have a strong fib and support at that zone. I see that as the bottom. $22-30 will be a great accumulation area.
Note
I wasn’t aware of the massive fud. Don’t even think about buying this project. Congratulations if you shorted this with me.Disclaimer
The information and publications are not meant to be, and do not constitute, financial, investment, trading, or other types of advice or recommendations supplied or endorsed by TradingView. Read more in the Terms of Use.
Disclaimer
The information and publications are not meant to be, and do not constitute, financial, investment, trading, or other types of advice or recommendations supplied or endorsed by TradingView. Read more in the Terms of Use.