Breaking above long descending trendline.
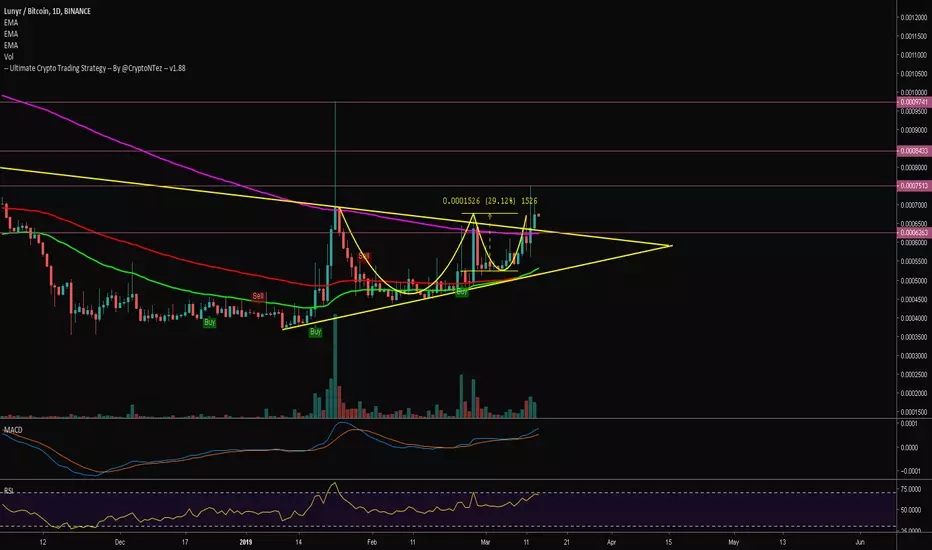
- Break above EMA50/100/200
- Volume increasing in the last few days.
- UCTS showing a buy signal on Feb23 (over 25% up till now)
- RSI/MACD bullish.
A retest of EMA200 can happen on the following days (RSI Oversold)
UCTS Indicator? Get a 10 days FREE trial at Cryptontez.com
Improve your Crypto Trading with 3commas. 3commas.io/?c=Cryptontez
Telegram Group: t.me/CryptontezTA
Improve your Crypto Trading with 3commas. 3commas.io/?c=Cryptontez
Telegram Group: t.me/CryptontezTA
Disclaimer
The information and publications are not meant to be, and do not constitute, financial, investment, trading, or other types of advice or recommendations supplied or endorsed by TradingView. Read more in the Terms of Use.