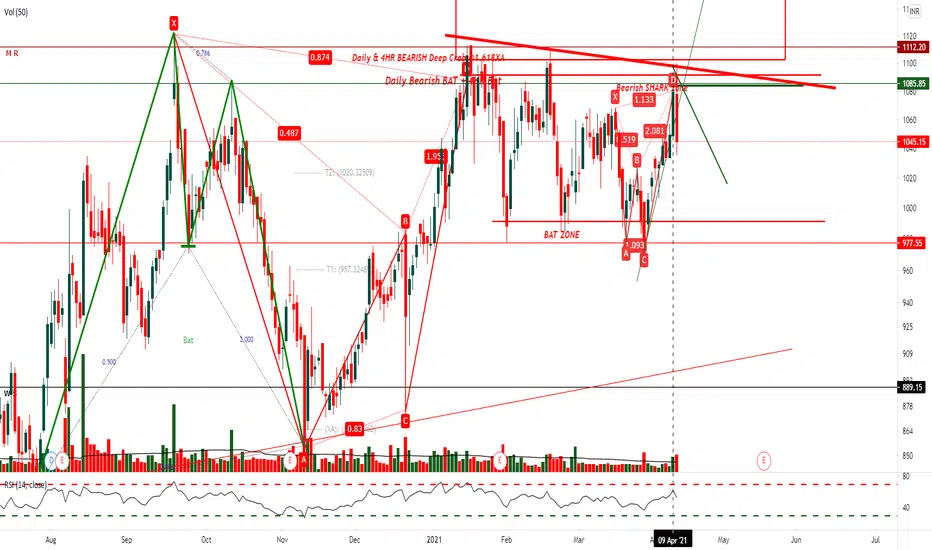
Confluence of Daily Bearish BAT & Bearish Shark STRONG POTENTIAL REVERSAL ZONES
Vertical dotted line is Top Reversal--it’s a two bar Sign Of Weakness. First bar is widespread up bar closing on/off the high with high volume (supply swamping demand) or low volume (no demand). The high and the close are higher than the previous few bars. The second bar is widespread down bar closing on/off the low on higher or lower volume than the first bar
second bar close & low are lower than the first bar low, on volume higher than the first bar volume, it shows effort to go down is successful --second bar high is higher than the first bar high it shows additional weakness. It shows immediate weakness--Effort vs Result & can be traded immediately on first No Demand or Up-thrust.
SELL
Disclaimer
The information and publications are not meant to be, and do not constitute, financial, investment, trading, or other types of advice or recommendations supplied or endorsed by TradingView. Read more in the Terms of Use.
Disclaimer
The information and publications are not meant to be, and do not constitute, financial, investment, trading, or other types of advice or recommendations supplied or endorsed by TradingView. Read more in the Terms of Use.