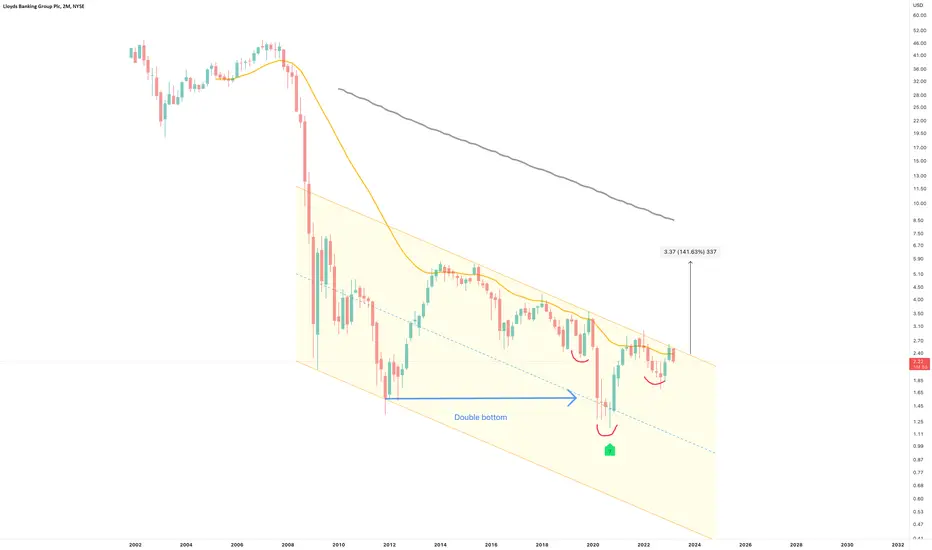
Talk about a 180. As soon as the JP idea is finished L for Lloyds is next, and my what a different picture. It seems as banks in the USA collapse that UK banks are set to see some serious cash inflow.
On the above 2-month chart price action has corrected over 90% from 2007 and never recovered. Until now. A number of reasons now exist to be long, including:
1) A strong buy signal (not shown) prints.
2) Regular bullish divergence. No less than seven oscillators. Four to five oscillators printing on this time frame is incredibly powerful but seven?!
3) Inverse head and shoulders pattern confirms with a break above 2.80 with a 5.80 target.
Is it possible price action falls further? Sure.
Is it probable? No.
Type: Investment
Risk: <=6% of portfolio
Timeframe: Don’t know.
Return: 140% to begin with.
Stop loss: 1.60
Trade active
Support confirmed.BTC
bc1q2eckdzh0q8vsd7swcc8et6ze7s99khhxyl7zwy
Weblink: patreon.com/withoutworries
Allow 3-6 months on ideas. Not investment advice. DYOR
bc1q2eckdzh0q8vsd7swcc8et6ze7s99khhxyl7zwy
Weblink: patreon.com/withoutworries
Allow 3-6 months on ideas. Not investment advice. DYOR
Disclaimer
The information and publications are not meant to be, and do not constitute, financial, investment, trading, or other types of advice or recommendations supplied or endorsed by TradingView. Read more in the Terms of Use.
BTC
bc1q2eckdzh0q8vsd7swcc8et6ze7s99khhxyl7zwy
Weblink: patreon.com/withoutworries
Allow 3-6 months on ideas. Not investment advice. DYOR
bc1q2eckdzh0q8vsd7swcc8et6ze7s99khhxyl7zwy
Weblink: patreon.com/withoutworries
Allow 3-6 months on ideas. Not investment advice. DYOR
Disclaimer
The information and publications are not meant to be, and do not constitute, financial, investment, trading, or other types of advice or recommendations supplied or endorsed by TradingView. Read more in the Terms of Use.