Technical Analysis for MAD/USDT
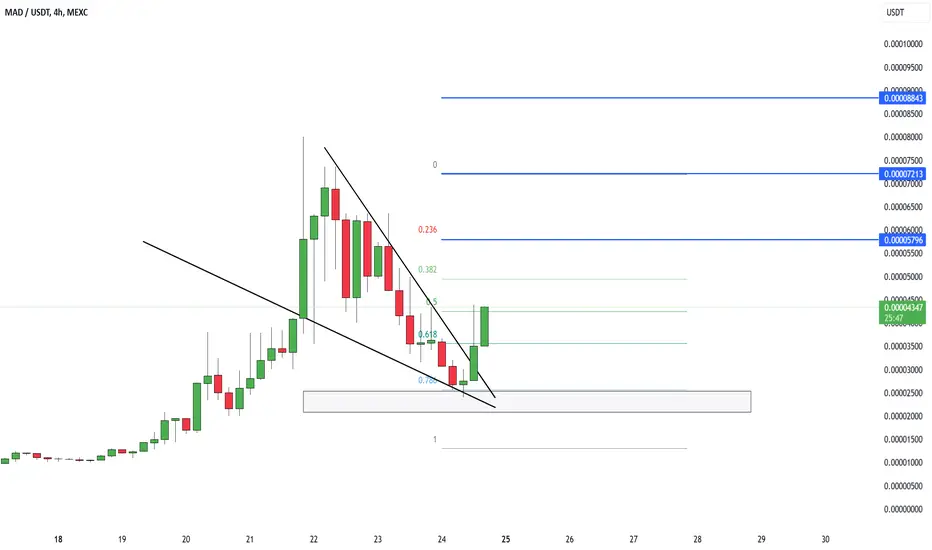
The cryptocurrency MAD is showing a Falling Wedge breakout on the chart, signaling a bullish continuation. With increased trading volume and strong buyer momentum, the price is likely to target higher resistance levels.
Support and Resistance Levels:
Support 1: 0.000035 (strong rebound zone).
Support 2: 0.000025 (in case of a deeper correction).
Resistance 1: 0.00005796 (key level to watch).
Resistance 2: 0.00007213.
Resistance 3: 0.00008843 (previous high).
Price Expectations:
Upside Potential: If the price breaks above 0.00005796, the next targets are 0.00007213 and 0.00008843.
Downside Risk: In case of a pullback, support at 0.000035 could serve as a strong bounce level.
Recommendation:
Short-term traders can take advantage of the bullish momentum and aim for the first resistance at 0.00005796.
Long-term investors should wait for a confirmed breakout above 0.00005796 before entering new positions.
#MAD #TechnicalAnalysis #Trading #Crypto #Cryptocurrency
Subscribe to my Telegram Channel 👉 :
t.me/addlist/y5mi70s3c0Y3MDQ0
Subscribe to my X 👉 : x.com/VIPROSETR
t.me/addlist/y5mi70s3c0Y3MDQ0
Subscribe to my X 👉 : x.com/VIPROSETR
Disclaimer
The information and publications are not meant to be, and do not constitute, financial, investment, trading, or other types of advice or recommendations supplied or endorsed by TradingView. Read more in the Terms of Use.