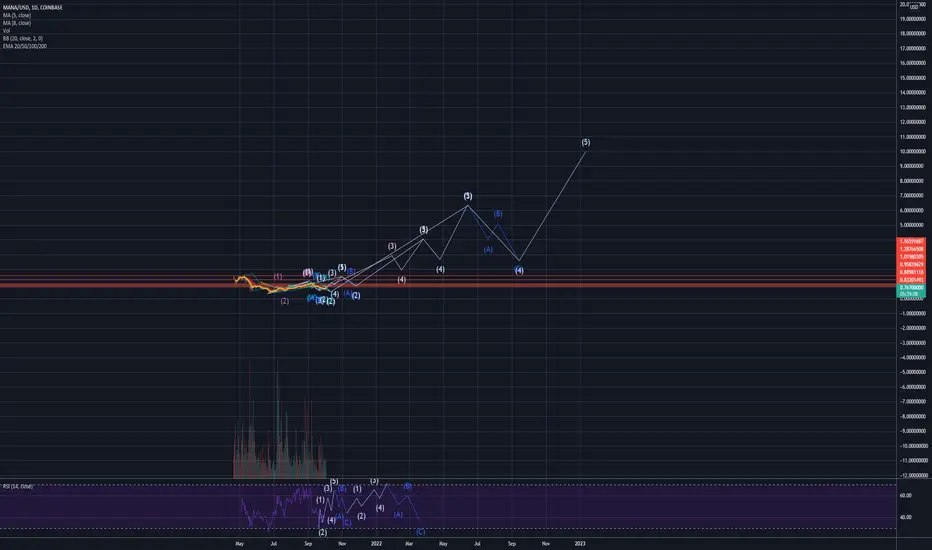
Can elliot wave theory be applied to RSI?
Trade closed: target reached
If mana continues, it could look something like the pink wave, if not, expect it to come back down to the light blue wave. Trade active
Update: We've touched the ABC retracement on the above chart. I've updated the chart and added a WXYXZ correction, similar to the chart on SAND we have a possibility to go lower into the .382 fib levels. The updated chart is a bit more cleaner and the white squiggly line is what might play out. I'll update after we get a clearer picture of where mana is going. Either we move up from here or go a bit further down. Disclaimer
The information and publications are not meant to be, and do not constitute, financial, investment, trading, or other types of advice or recommendations supplied or endorsed by TradingView. Read more in the Terms of Use.
Disclaimer
The information and publications are not meant to be, and do not constitute, financial, investment, trading, or other types of advice or recommendations supplied or endorsed by TradingView. Read more in the Terms of Use.