Hello?
Traders, welcome.
If you "Follow", you can always get new information quickly.
Please also click "Boost".
Have a nice day.
-------------------------------------
(MANABTC 1W chart)

In order to release the power of a full-fledged rise, it is necessary to check whether it can rise above 0.0000 3732.
-------------------------------------------
(MANAUSDT 1W chart)

In order to continue the mid- to long-term upward trend, the key is whether it can rise to the 0.7051-1.0952 range.
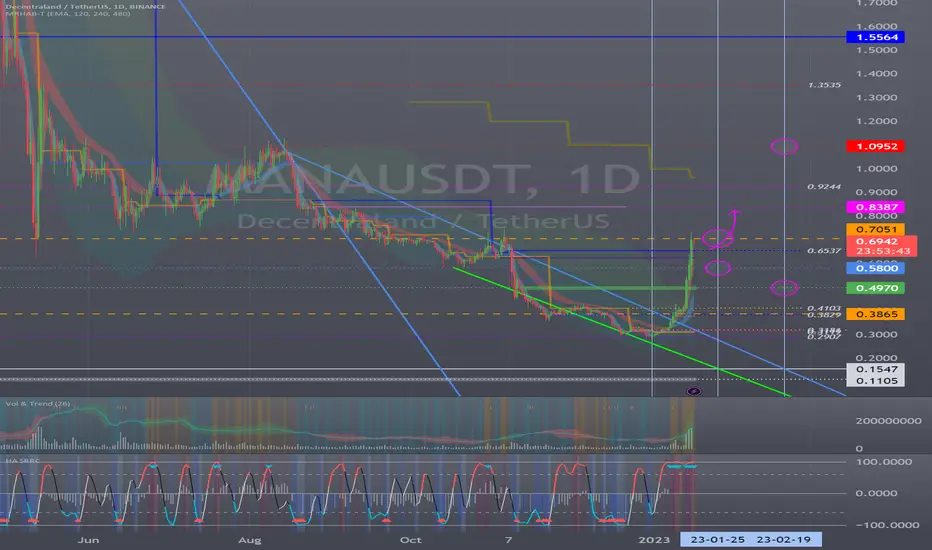
(1D chart)
If possible, the question is whether support above 0.6537 can lead to an upward move above 0.7051.
If not, it falls
1st: around 0.58
2nd order: around 0.4970
You need to check if it is supported in the 1st and 2nd sections.
If it falls below the 2nd section, there is a possibility that it will turn into a downtrend.
when it rises,
1st: around 0.8387
2nd order: around 1.0952
It is necessary to check whether the 1st and 2nd sections are touched.
-------------------------------------------------- -------------------------------------------
** All descriptions are for reference only and do not guarantee profit or loss in investment.
** If this chart is shared, you can use the indicators normally.
** The MRHAB-T indicator includes indicators that indicate points of support and resistance.
** HA SRRC indicators are displayed as StochRSI (line), RSI (columns), and CCI (bgcolor).
** The CCI indicator is displayed in the overbought section (CCI > +100) and oversold section (CCI < -100).
(Short-term Stop Loss can be said to be a point where profit or loss can be preserved or additional entry can be made by split trading. This is a short-term investment perspective.)
---------------------------------
Traders, welcome.
If you "Follow", you can always get new information quickly.
Please also click "Boost".
Have a nice day.
-------------------------------------
(MANABTC 1W chart)
In order to release the power of a full-fledged rise, it is necessary to check whether it can rise above 0.0000 3732.
-------------------------------------------
(MANAUSDT 1W chart)
In order to continue the mid- to long-term upward trend, the key is whether it can rise to the 0.7051-1.0952 range.
(1D chart)
If possible, the question is whether support above 0.6537 can lead to an upward move above 0.7051.
If not, it falls
1st: around 0.58
2nd order: around 0.4970
You need to check if it is supported in the 1st and 2nd sections.
If it falls below the 2nd section, there is a possibility that it will turn into a downtrend.
when it rises,
1st: around 0.8387
2nd order: around 1.0952
It is necessary to check whether the 1st and 2nd sections are touched.
-------------------------------------------------- -------------------------------------------
** All descriptions are for reference only and do not guarantee profit or loss in investment.
** If this chart is shared, you can use the indicators normally.
** The MRHAB-T indicator includes indicators that indicate points of support and resistance.
** HA SRRC indicators are displayed as StochRSI (line), RSI (columns), and CCI (bgcolor).
** The CCI indicator is displayed in the overbought section (CCI > +100) and oversold section (CCI < -100).
(Short-term Stop Loss can be said to be a point where profit or loss can be preserved or additional entry can be made by split trading. This is a short-term investment perspective.)
---------------------------------
Other content (coins, stocks, etc.) is frequently posted on X.
X에 다른 내용(코인, 주식 등)이 자주 게시.
◆ t.me/readCryptoChannel
[HA-MS Indicator]
bit.ly/3YxHgvN
[OBV Indicator]
bit.ly/4dcyny3
X에 다른 내용(코인, 주식 등)이 자주 게시.
◆ t.me/readCryptoChannel
[HA-MS Indicator]
bit.ly/3YxHgvN
[OBV Indicator]
bit.ly/4dcyny3
Related publications
Disclaimer
The information and publications are not meant to be, and do not constitute, financial, investment, trading, or other types of advice or recommendations supplied or endorsed by TradingView. Read more in the Terms of Use.