MAR (Marriott International)
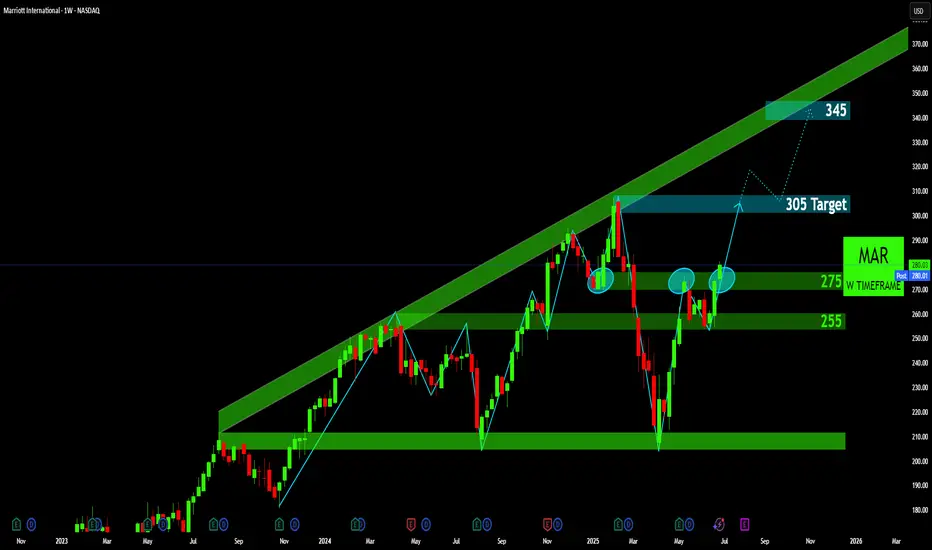
MAR is currently displaying a constructive bullish setup within a long-term ascending channel. The price is at a critical juncture, testing a key horizontal resistance level that could determine the next major price leg.
Analysis Breakdown:
1. The Dominant Ascending Channel: The most prominent feature on the chart is the broad, upward-sloping green channel that has contained price action since late 2023. This channel clearly defines the long-term bullish trend, with the price respecting both the lower (support) and upper (resistance) trendlines. As long as the price remains within this channel, the macro trend is considered bullish.
2. Key Horizontal Levels:
o 275 (Pivotal Zone): This level is the most critical area on the chart right now. It previously acted as support (highlighted by the first light-blue oval) before the price broke down. It is now being tested as resistance (highlighted by the two recent ovals). This is a classic example of a support/resistance flip, making it a significant hurdle for bulls to overcome.
o 255 (Support): This level has recently served as a solid support base, from which the current rally was initiated. It represents the first key support to watch if the price is rejected from the 275 zone.
o ~210 (Major Support): This is the foundational support level that coincides with the lower boundary of the ascending channel, marking the start of the strong uptrend in late 2023.
3. Potential Bullish Pattern (W-Pattern / Inverse Head & Shoulders): The price action since the peak in early 2025 has carved out a potential bullish reversal or continuation pattern. The structure resembles a W-pattern (or double bottom), with the second low being higher than the first, which is a sign of underlying strength. Alternatively, it can be viewed as an Inverse Head and Shoulders pattern, with the 275-level acting as the "neckline." The ovals highlight the formation of the "shoulders" around this critical neckline.
4. The Projected Bullish Scenario: The chart outlines a potential path forward if the bullish structure plays out:
o Breakout: The immediate catalyst for this scenario would be a decisive weekly close above the 275-resistance level.
o Target 1: 305: A successful breakout would open the door to the first projected target at 305. This level also aligns with the previous swing high, making it a logical area of interest. The dotted line suggests a possible retest of the 275-breakout zone before continuing upward.
o Target 2: 345: Should the upward momentum continue, the next major target is identified at 345. This price level aligns perfectly with the upper trendline of the long-term ascending channel, suggesting it could be a potential peak for this cycle.
Disclaimer:
The information provided in this chart is for educational and informational purposes only and should not be considered as investment advice. Trading and investing involve substantial risk and are not suitable for every investor. You should carefully consider your financial situation and consult with a financial advisor before making any investment decisions. The creator of this chart does not guarantee any specific outcome or profit and is not responsible for any losses incurred as a result of using this information. Past performance is not indicative of future results. Use this information at your own risk. This chart has been created for my own improvement in Trading and Investment Analysis. Please do your own analysis before any investments.
Disclaimer
The information and publications are not meant to be, and do not constitute, financial, investment, trading, or other types of advice or recommendations supplied or endorsed by TradingView. Read more in the Terms of Use.
Disclaimer
The information and publications are not meant to be, and do not constitute, financial, investment, trading, or other types of advice or recommendations supplied or endorsed by TradingView. Read more in the Terms of Use.