---
🕵️♂️ Bullish Reversal Detected on Marriott (4H) – Triple Confirmation Setup
📆 Timeframe: 4H
📍 Symbol: MAR (Marriott International)
Just spotted a clean triple confirmation setup using candlestick patterns, momentum, and price action reaction. This is the kind of entry that stands out when you’re waiting patiently for the market to align.
---
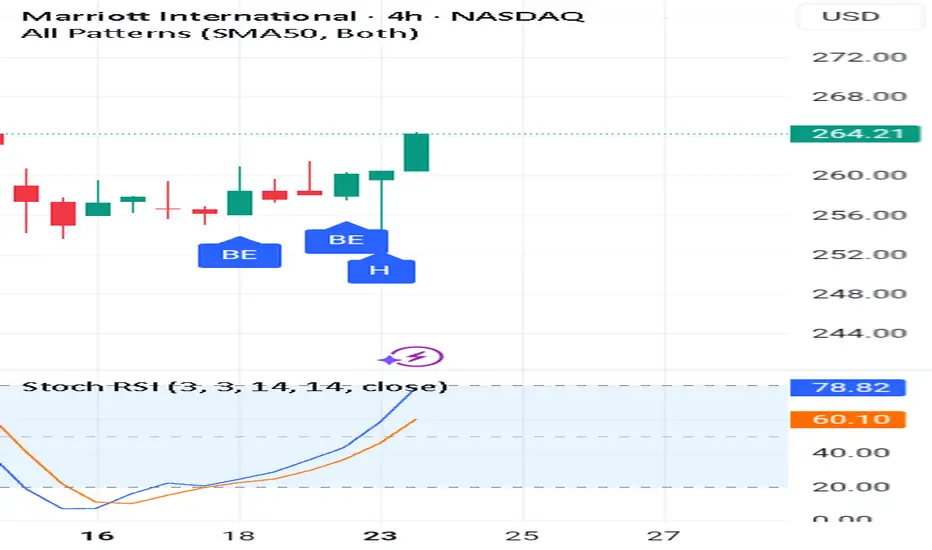
✅ Setup Breakdown:
1. Bullish Engulfing Pattern (BE)
A strong engulfing candle formed at the bottom of a down move.
Backed up by a second BE, strengthening the reversal signal.
2. Hammer Candle (H)
A hammer appeared right after, confirming rejection of lower prices.
This added strong confluence to the setup.
3. Stochastic RSI Reversal
Stoch RSI bounced from below 20 and is now above 60.
Momentum has shifted upward — clear sign of strength.
4. Price Action Follow-Through
Strong bullish candle followed the pattern.
Price reacted exactly how you'd want to see after a bottom setup.
---
🎯 Trade Plan:
Entry: Above the bullish engulfing high (~$256.50+)
Stop Loss: Below the hammer low (~$251.00)
Target: Around $268–$272 (recent resistance zone)
---
📌 Summary:
When candlestick structure, momentum indicators, and reaction candles all agree — that’s a powerful signal. I’ll continue to watch how price behaves near resistance.
How do you approach entries like this? Do you wait for this kind of pattern confluence too?
--
Rocket Boost This Content To Learn More
---
⚠️ Disclaimer:
This post is for educational and informational purposes only and does not constitute financial advice. Always do your own research and consult a licensed financial advisor before making any trading decisions. Trading involves risk and can result in the loss of capital.
🕵️♂️ Bullish Reversal Detected on Marriott (4H) – Triple Confirmation Setup
📆 Timeframe: 4H
📍 Symbol:
Just spotted a clean triple confirmation setup using candlestick patterns, momentum, and price action reaction. This is the kind of entry that stands out when you’re waiting patiently for the market to align.
---
✅ Setup Breakdown:
1. Bullish Engulfing Pattern (BE)
A strong engulfing candle formed at the bottom of a down move.
Backed up by a second BE, strengthening the reversal signal.
2. Hammer Candle (H)
A hammer appeared right after, confirming rejection of lower prices.
This added strong confluence to the setup.
3. Stochastic RSI Reversal
Stoch RSI bounced from below 20 and is now above 60.
Momentum has shifted upward — clear sign of strength.
4. Price Action Follow-Through
Strong bullish candle followed the pattern.
Price reacted exactly how you'd want to see after a bottom setup.
---
🎯 Trade Plan:
Entry: Above the bullish engulfing high (~$256.50+)
Stop Loss: Below the hammer low (~$251.00)
Target: Around $268–$272 (recent resistance zone)
---
📌 Summary:
When candlestick structure, momentum indicators, and reaction candles all agree — that’s a powerful signal. I’ll continue to watch how price behaves near resistance.
How do you approach entries like this? Do you wait for this kind of pattern confluence too?
--
Rocket Boost This Content To Learn More
---
⚠️ Disclaimer:
This post is for educational and informational purposes only and does not constitute financial advice. Always do your own research and consult a licensed financial advisor before making any trading decisions. Trading involves risk and can result in the loss of capital.
Related publications
Disclaimer
The information and publications are not meant to be, and do not constitute, financial, investment, trading, or other types of advice or recommendations supplied or endorsed by TradingView. Read more in the Terms of Use.
Related publications
Disclaimer
The information and publications are not meant to be, and do not constitute, financial, investment, trading, or other types of advice or recommendations supplied or endorsed by TradingView. Read more in the Terms of Use.