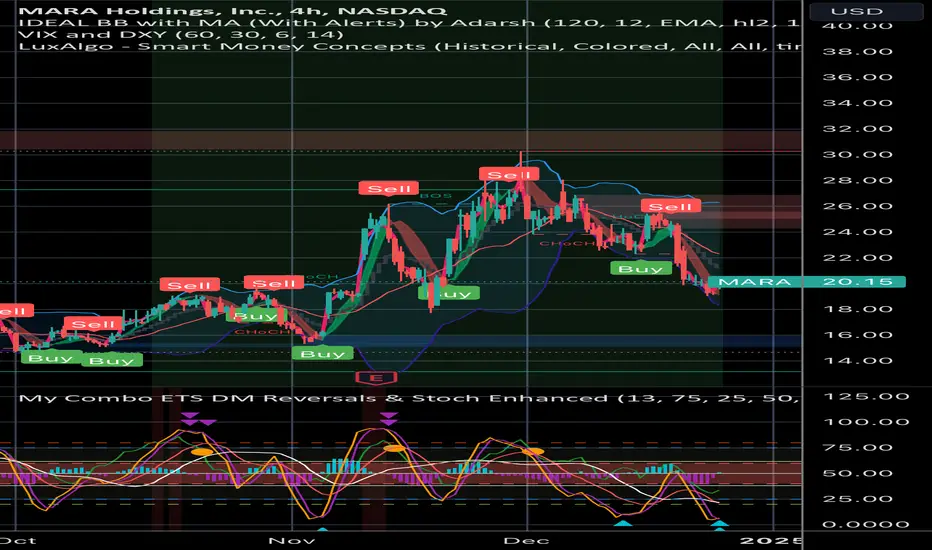
The chart provided shows MARA Holdings on the 4-hour time frame, utilising a combination of indicators and tools such as the Bollinger Bands, Hull Moving Average, and stochastic oscillators, as well as buy and sell signals. Here is the technical analysis:
Trend Analysis
The stock price appears to have experienced significant volatility within the highlighted range. MARA is currently trading at $20.15, showing a 4.68% upward movement in the most recent session. The price has bounced from a support zone near $18, indicating potential buying interest at that level. However, the chart shows frequent changes between buy and sell signals, reflecting a choppy or range-bound market rather than a clear directional trend. The upper resistance level seems to be around $24–$26, where previous sell signals clustered.
The Hull Moving Average (HMA) lines and Bollinger Bands reveal narrowing price action recently, which may signal a period of consolidation. This can often precede a breakout. Traders should monitor the direction of any break from this range for future momentum trades.
Indicators
The stochastic oscillator below the main chart is entering oversold territory, as indicated by the crossing lines near the lower range. This suggests a potential bullish reversal in the near term if the stock maintains its support level. Additionally, the buy signals have started clustering as the price approaches the lower Bollinger Band, which often acts as dynamic support.
The sell signals at higher levels around $22–$24 suggest these are strong resistance areas, as the stock repeatedly failed to break through them. However, the recent upward movement and increasing buying pressure could indicate building bullish momentum if the price successfully breaks above the $22 level.
Recommendations
• For Bullish Traders: Consider entering a long position near the $18–$20 support range, with a target price of $22 (initial resistance) and $24 (secondary resistance). Ensure to place a stop-loss slightly below the $18 level to manage downside risks.
• For Bearish Traders: If the stock fails to break $22 and shows signs of reversal, consider a short trade targeting the $20–$18 zone, where the previous support lies. Watch for weakening stochastic and declining volume for confirmation.
As MARA has a volatile trading history, ensure to manage risk effectively and adapt positions based on breakout or breakdown patterns in this consolidative range.
My take
Considering the favourable longer trend (1D) this is a good trade on across multiple time frames which makes me more confident that this is a good bullish directional trade
Disclaimer
The information and publications are not meant to be, and do not constitute, financial, investment, trading, or other types of advice or recommendations supplied or endorsed by TradingView. Read more in the Terms of Use.
Disclaimer
The information and publications are not meant to be, and do not constitute, financial, investment, trading, or other types of advice or recommendations supplied or endorsed by TradingView. Read more in the Terms of Use.