MARA
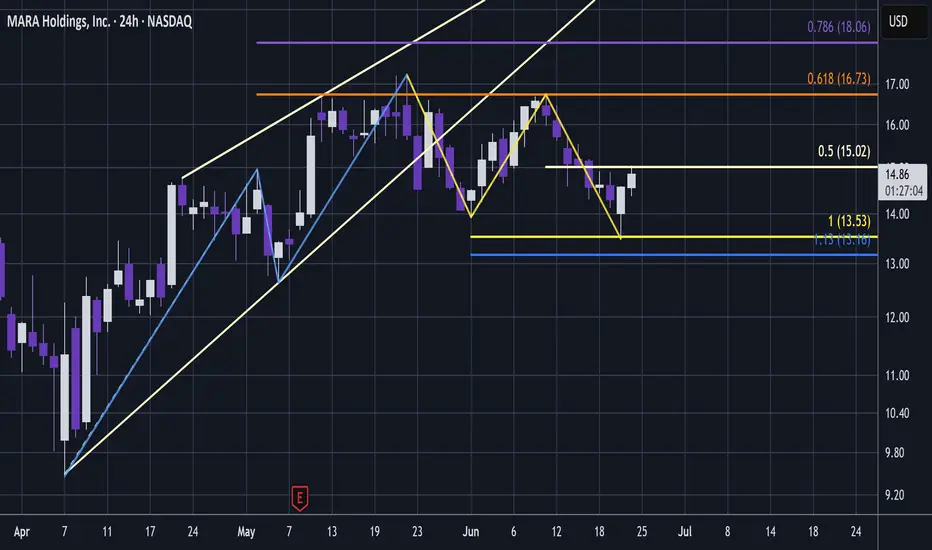
Similar to Bitcoin , MARA bounced from a 1:1 extension:

And so a 3 wave correction completed in symmetry.
So on MARA chart, from April lows we have;
- A weak 1:0.618 (GW) 3 wave upside bounce (blue line).
- A shallow and descending 1:1 3 wave correction (yellow line).
- And a 0.5 retracement bounce.
The bounce is weaker than Bitcoin and overall the chart looks weak also considering the 1:0.618 extension ~ weak because the third wave is shorter and a sign of waning momentum.
If Bitcoin will at some point move on up then there is a possibility that this 3 wave correction is a connecting and momentum shifting Pattern Separation from the bearish 1:0.618 wave up, into a more bullish future wave up.
But overall the chart looks weak to my eyes.
I am going to somewhat play both sides here because Bitcoin is printing upside liquidity sweeping action.

This signals some sort of downside in the pipeline.
...
In this area I do not yet have too much idea whether the Bitcoin bounce has real impetus or it is an unstable short squeeze that would lead to impulsive downside.
But I do think that some downside is coming; either a pull back or the dominant trend continuing down.
And so this is my opportunity to take the short term signal to get in early on a MARA short.
...
If MARA is weak compared to Bitcoin and Bitcoin grinds higher, there is a reasonable chance that MARA will start falling.
But another significant consideration is that Nasdaq made a new ATH today ~ MARA is part of the Nasdaq index.
Since Nasdaq has tapped into higher liquidity above previous ATH, there is a reasonable chance that Nasdaq will not be making much more significant Y axis discovery to the upside.
And so; similar to the relationship with Bitcoin; if Nasdaq grinds higher and MARA is weak comparing to Nasdaq, then MARA may start falling away.
With both Bitcoin and Nasdaq potentially in some sort of distributive (topping) territory and a potential MARA having a weak relationship with both, in the most bearish scenario MARA may capitulate down and down from here.
And in the more bullish scenario I may make a small loss or perhaps breakeven.
So I bought a few short positions here 👍.
This analysis is shared for educational purposes only and does not constitute financial advice. Please conduct your own research before making any trading decisions.
Similar to Bitcoin , MARA bounced from a 1:1 extension:
And so a 3 wave correction completed in symmetry.
So on MARA chart, from April lows we have;
- A weak 1:0.618 (GW) 3 wave upside bounce (blue line).
- A shallow and descending 1:1 3 wave correction (yellow line).
- And a 0.5 retracement bounce.
The bounce is weaker than Bitcoin and overall the chart looks weak also considering the 1:0.618 extension ~ weak because the third wave is shorter and a sign of waning momentum.
If Bitcoin will at some point move on up then there is a possibility that this 3 wave correction is a connecting and momentum shifting Pattern Separation from the bearish 1:0.618 wave up, into a more bullish future wave up.
But overall the chart looks weak to my eyes.
I am going to somewhat play both sides here because Bitcoin is printing upside liquidity sweeping action.
This signals some sort of downside in the pipeline.
...
In this area I do not yet have too much idea whether the Bitcoin bounce has real impetus or it is an unstable short squeeze that would lead to impulsive downside.
But I do think that some downside is coming; either a pull back or the dominant trend continuing down.
And so this is my opportunity to take the short term signal to get in early on a MARA short.
...
If MARA is weak compared to Bitcoin and Bitcoin grinds higher, there is a reasonable chance that MARA will start falling.
But another significant consideration is that Nasdaq made a new ATH today ~ MARA is part of the Nasdaq index.
Since Nasdaq has tapped into higher liquidity above previous ATH, there is a reasonable chance that Nasdaq will not be making much more significant Y axis discovery to the upside.
And so; similar to the relationship with Bitcoin; if Nasdaq grinds higher and MARA is weak comparing to Nasdaq, then MARA may start falling away.
With both Bitcoin and Nasdaq potentially in some sort of distributive (topping) territory and a potential MARA having a weak relationship with both, in the most bearish scenario MARA may capitulate down and down from here.
And in the more bullish scenario I may make a small loss or perhaps breakeven.
So I bought a few short positions here 👍.
This analysis is shared for educational purposes only and does not constitute financial advice. Please conduct your own research before making any trading decisions.
Note
MARA printing a nasty upside shakeout today.And this is developing into a great short opportunity.
I bought more short positions today.
Your FA guru can't read a chart💭
I run a technical group with lots of content every day + regular videos, 1:1, chatroom 🚀.
Better than all the rest? My record speaks for itself 💡.
Telegram Group: $50 per month✨.
Contact: t.me/dRends35
I run a technical group with lots of content every day + regular videos, 1:1, chatroom 🚀.
Better than all the rest? My record speaks for itself 💡.
Telegram Group: $50 per month✨.
Contact: t.me/dRends35
Disclaimer
The information and publications are not meant to be, and do not constitute, financial, investment, trading, or other types of advice or recommendations supplied or endorsed by TradingView. Read more in the Terms of Use.