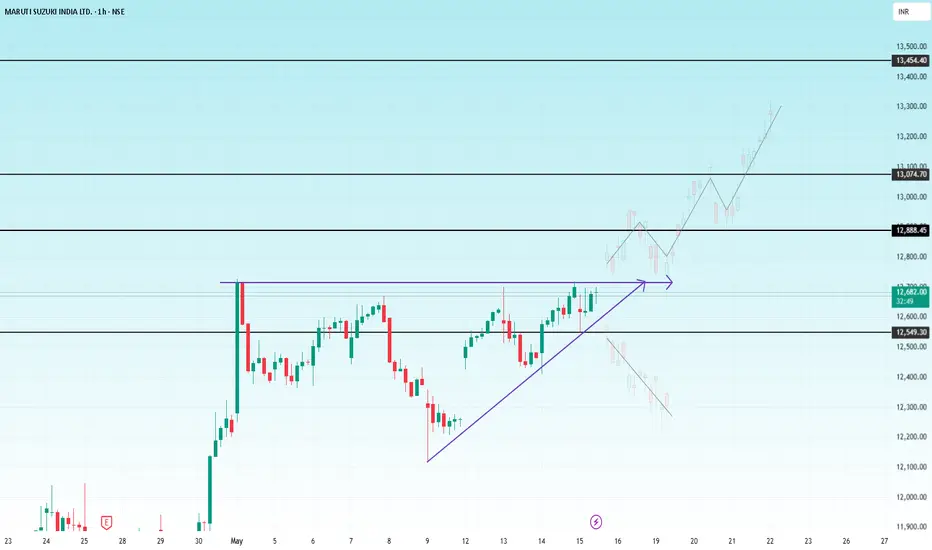
Maruti Suzuki is currently forming a bullish ascending triangle pattern on the 1-hour chart, indicating potential for an upside breakout.
1. Pattern Formation: The price is making higher lows while facing horizontal resistance near the 12,700 zone — forming a classic ascending triangle.
2. Support Zone: Trendline support is holding well, currently near 12,550.
3. Breakout Levels: A confirmed breakout above 12,700 could trigger a sharp move toward the next resistances at 12,888, 13,075, and possibly 13,454.
4. Bullish: Post-breakout, price action is expected to retest and then rally — as shown by the projection arrows on the chart.
5. Volume Confirmation: Watch for volume expansion on breakout to confirm strength.
Trading Plan:
Buy on Breakout: Enter long above 12,700 with targets of 12,888 - 13,075 - 13,454. Use SL below 12,550.
Wait-and-Watch: If price fails to break out, stock may stay range-bound or retest trendline support.
Conclusion:
Price action suggests strength building up. A breakout from this pattern could lead to a fresh rally — ideal setup for short-term swing trades
Trade active
target 1 done of 13075Related publications
Disclaimer
The information and publications are not meant to be, and do not constitute, financial, investment, trading, or other types of advice or recommendations supplied or endorsed by TradingView. Read more in the Terms of Use.
Related publications
Disclaimer
The information and publications are not meant to be, and do not constitute, financial, investment, trading, or other types of advice or recommendations supplied or endorsed by TradingView. Read more in the Terms of Use.