Hello Crypto Lovers,
Mars Signals team wishes you high profits.
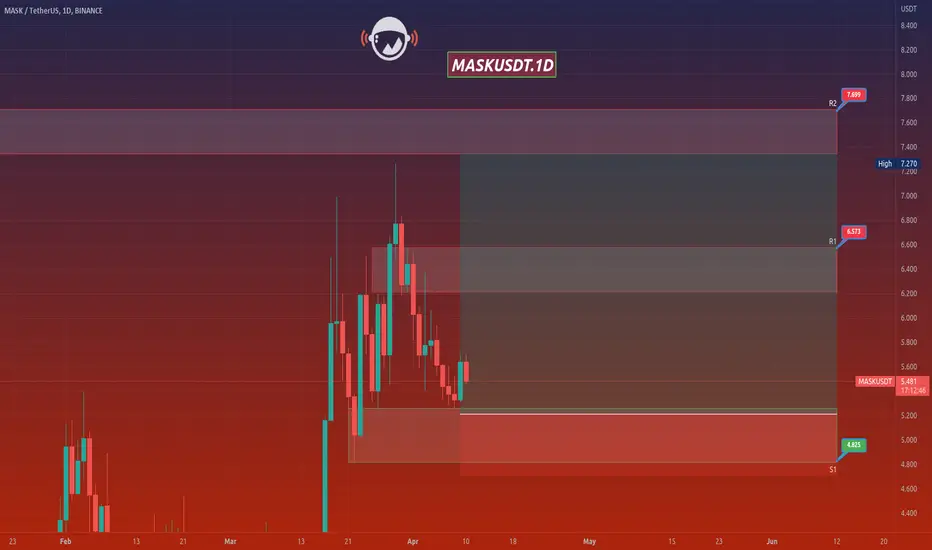
This is a one-day-time frame analysis for MASKUSDT
There is R2 on the top of the chart which is a long-term resistance line and represents the unsuccessful triumphs of the price to rise at several points. R1 is another resistance area. And as you observe, S1 is our support area with the support of price even since the past. Presently, we see the fluctuation of price over S1. Our expectation would include more decline for the price to reach S1. Here if the price is able to be supported, more increase is there for it to higher amounts such as R2. Or it is even possible that the price starts its rising trend at its current point and reach higher amount. In case the price loses the support at S1 or by the time it touches R1, besides providing us some falling signs, more decline would take place to lower amounts. It is less probable that the price falls below S1 and experience more fall. It is crucial to consider the market situation in lower time frames and then decide what to do exactly; based on the multiple pieces of information which you would obtain from our analyses and updates.
Warning: This is just a suggestion and we do not guarantee profits. We advise you to analyze the chart before opening any positions.
Wish you luck
Mars Signals team wishes you high profits.
This is a one-day-time frame analysis for MASKUSDT
There is R2 on the top of the chart which is a long-term resistance line and represents the unsuccessful triumphs of the price to rise at several points. R1 is another resistance area. And as you observe, S1 is our support area with the support of price even since the past. Presently, we see the fluctuation of price over S1. Our expectation would include more decline for the price to reach S1. Here if the price is able to be supported, more increase is there for it to higher amounts such as R2. Or it is even possible that the price starts its rising trend at its current point and reach higher amount. In case the price loses the support at S1 or by the time it touches R1, besides providing us some falling signs, more decline would take place to lower amounts. It is less probable that the price falls below S1 and experience more fall. It is crucial to consider the market situation in lower time frames and then decide what to do exactly; based on the multiple pieces of information which you would obtain from our analyses and updates.
Warning: This is just a suggestion and we do not guarantee profits. We advise you to analyze the chart before opening any positions.
Wish you luck
Disclaimer
The information and publications are not meant to be, and do not constitute, financial, investment, trading, or other types of advice or recommendations supplied or endorsed by TradingView. Read more in the Terms of Use.
Disclaimer
The information and publications are not meant to be, and do not constitute, financial, investment, trading, or other types of advice or recommendations supplied or endorsed by TradingView. Read more in the Terms of Use.