Hello dear Traders,
Here is my idea for #Polygon
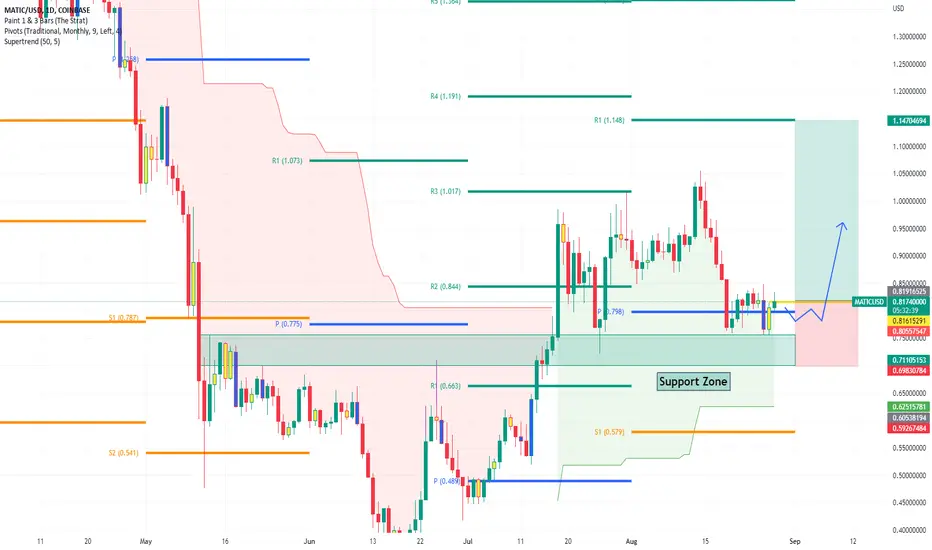
Price finds support at monthly pivot line.
Daily inside bar has been formed and we will wait for a close above the yellow trigger line (0.8170$) in the 4h chart to enter the trade.
Profit target 1.1470$ and stop 0.6980$.
Risk Reward ratio 2.7
Please feel free to ask any question in comments. I will try to answer all! Thank you.
About #Polygon
Rank 12 by marked cap
Polygon (previously Matic Network) is the first well-structured, easy-to-use platform for Ethereum scaling and infrastructure development. Its core component is Polygon SDK, a modular, flexible framework that supports building multiple types of applications.
Using Polygon, one can create optimistic rollup chains, ZK rollup chains, stand alone chains or any other kind of infra required by the developer.
Polygon effectively transforms Ethereum into a full-fledged multi-chain system (aka Internet of Blockchains). This multi-chain system is akin to other ones such as Polkadot, Cosmos, Avalanche etc. with the advantages of Ethereum’s security, vibrant ecosystem and openness.
The MMATIC token will continue to exist and will play an increasingly important role, securing the system and enabling governance
Source: Polygon price today, MATIC to USD live, marketcap and chart | CoinMarketCap
About Pivot Lines
The term monthly indicates that the pivot levels are calculated using the prior month’s high, low and closing price. The basic formulas are now well-known and pivot calculators are readily available on Tradingview.
If a market closes above the monthly pivot, then the trend is positive, and closing below the pivot is negative. In a positive market, you look for prices to pause, or maybe even reverse, at the first pivot resistance level (R1). If that level is exceeded, then the R2 is the next level to watch. Conversely, when a market drops below the monthly pivot, then the first downside target is the first pivot support (S1), and the second support is S2.
Source: Learn How To Use Monthly Pivot Analysis (forbes.com)
Here is my idea for #Polygon
Price finds support at monthly pivot line.
Daily inside bar has been formed and we will wait for a close above the yellow trigger line (0.8170$) in the 4h chart to enter the trade.
Profit target 1.1470$ and stop 0.6980$.
Risk Reward ratio 2.7
Please feel free to ask any question in comments. I will try to answer all! Thank you.
About #Polygon
Rank 12 by marked cap
Polygon (previously Matic Network) is the first well-structured, easy-to-use platform for Ethereum scaling and infrastructure development. Its core component is Polygon SDK, a modular, flexible framework that supports building multiple types of applications.
Using Polygon, one can create optimistic rollup chains, ZK rollup chains, stand alone chains or any other kind of infra required by the developer.
Polygon effectively transforms Ethereum into a full-fledged multi-chain system (aka Internet of Blockchains). This multi-chain system is akin to other ones such as Polkadot, Cosmos, Avalanche etc. with the advantages of Ethereum’s security, vibrant ecosystem and openness.
The MMATIC token will continue to exist and will play an increasingly important role, securing the system and enabling governance
Source: Polygon price today, MATIC to USD live, marketcap and chart | CoinMarketCap
About Pivot Lines
The term monthly indicates that the pivot levels are calculated using the prior month’s high, low and closing price. The basic formulas are now well-known and pivot calculators are readily available on Tradingview.
If a market closes above the monthly pivot, then the trend is positive, and closing below the pivot is negative. In a positive market, you look for prices to pause, or maybe even reverse, at the first pivot resistance level (R1). If that level is exceeded, then the R2 is the next level to watch. Conversely, when a market drops below the monthly pivot, then the first downside target is the first pivot support (S1), and the second support is S2.
Source: Learn How To Use Monthly Pivot Analysis (forbes.com)
Disclaimer
The information and publications are not meant to be, and do not constitute, financial, investment, trading, or other types of advice or recommendations supplied or endorsed by TradingView. Read more in the Terms of Use.
Disclaimer
The information and publications are not meant to be, and do not constitute, financial, investment, trading, or other types of advice or recommendations supplied or endorsed by TradingView. Read more in the Terms of Use.