MATIC price action shows a sharp decline, leading to the formation of a triangle pattern.
A potential breakdown could see MATIC prices fall below $0.50 to $0.4480.
Conversely, a bullish reversal might propel MATIC prices to $0.70.
Polygon's price has found support at $0.53, hinting at a short recovery.
The upcoming Bitcoin ETF's SEC deadline might bring a bullish spike for altcoins.
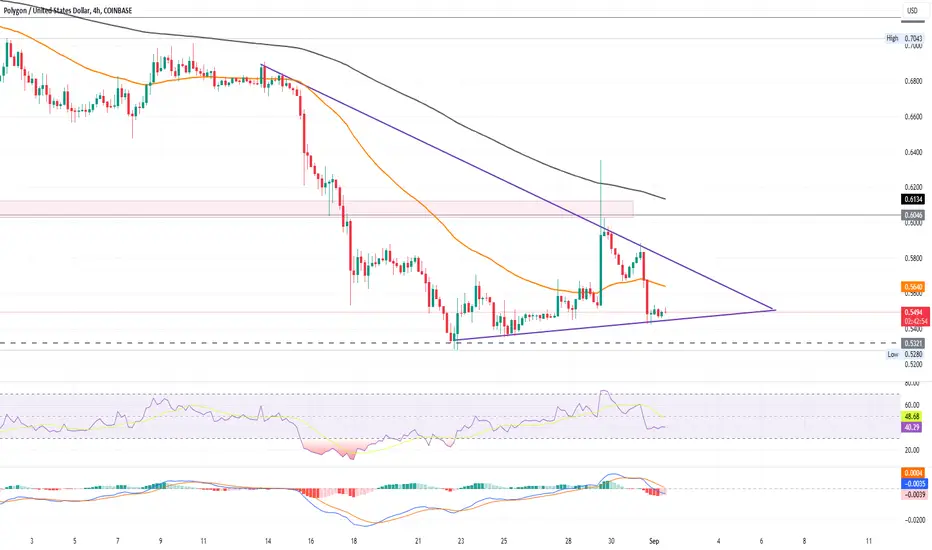
MATIC's price action within the 4-hour chart forms a triangle pattern due to the resistance trendline.
Despite crashing to the triangle's support trendline, MATIC prices have held firm.
A potential positive cycle could see MATIC prices rise within the triangle.
However, the recent 7.72% drop in 48 hours suggests a possible downtrend for Polygon below $0.50.
Technical indicators like MACD and RSI show a bearish trend in the 4-hour chart, with the declining 50 and 200-day EMA reinforcing this sentiment.
MATIC's price is trapped in a triangle, indicating a potential sharp move upon breakout.
A bearish breakdown could push MATIC prices to $0.4480, while a bullish breakout might see prices nearing the $0.70 mark.
A potential breakdown could see MATIC prices fall below $0.50 to $0.4480.
Conversely, a bullish reversal might propel MATIC prices to $0.70.
Polygon's price has found support at $0.53, hinting at a short recovery.
The upcoming Bitcoin ETF's SEC deadline might bring a bullish spike for altcoins.
MATIC's price action within the 4-hour chart forms a triangle pattern due to the resistance trendline.
Despite crashing to the triangle's support trendline, MATIC prices have held firm.
A potential positive cycle could see MATIC prices rise within the triangle.
However, the recent 7.72% drop in 48 hours suggests a possible downtrend for Polygon below $0.50.
Technical indicators like MACD and RSI show a bearish trend in the 4-hour chart, with the declining 50 and 200-day EMA reinforcing this sentiment.
MATIC's price is trapped in a triangle, indicating a potential sharp move upon breakout.
A bearish breakdown could push MATIC prices to $0.4480, while a bullish breakout might see prices nearing the $0.70 mark.
Disclaimer
The information and publications are not meant to be, and do not constitute, financial, investment, trading, or other types of advice or recommendations supplied or endorsed by TradingView. Read more in the Terms of Use.
Disclaimer
The information and publications are not meant to be, and do not constitute, financial, investment, trading, or other types of advice or recommendations supplied or endorsed by TradingView. Read more in the Terms of Use.