Long
MATICUSD ❕ bullish takeover
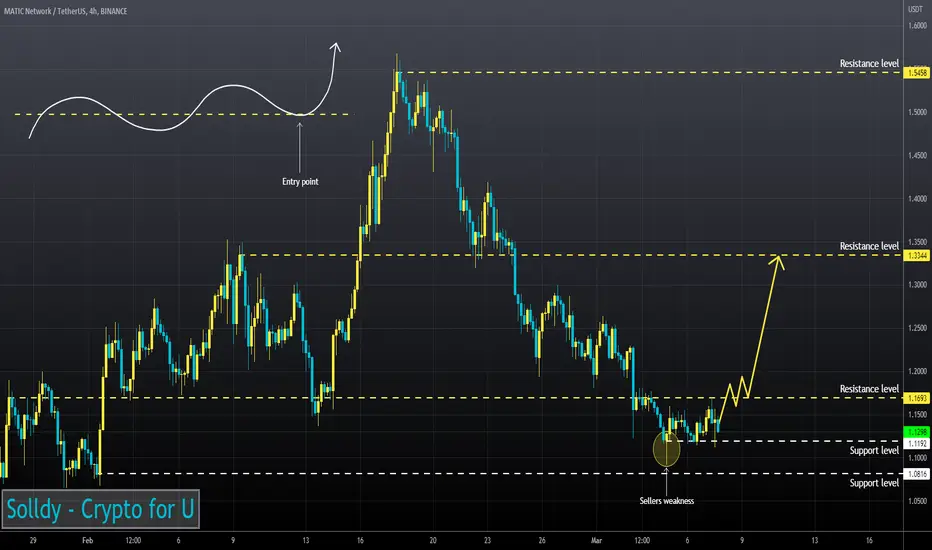
Price and RSI chart form a bullish divergence (4H TF)
MATIC has fixed above 50EMA (1H TF)
50EMA has broken up 200EMA (30m TF)
The asset will begin to bounce after it overcomes the resistance level.
MATIC has fixed above 50EMA (1H TF)
50EMA has broken up 200EMA (30m TF)
The asset will begin to bounce after it overcomes the resistance level.
Disclaimer
The information and publications are not meant to be, and do not constitute, financial, investment, trading, or other types of advice or recommendations supplied or endorsed by TradingView. Read more in the Terms of Use.
Disclaimer
The information and publications are not meant to be, and do not constitute, financial, investment, trading, or other types of advice or recommendations supplied or endorsed by TradingView. Read more in the Terms of Use.