Could it rise above the key point of 0.8647...
Happy new year!
Traders, welcome.
If you "Follow", you can always get new information quickly.
Please also click "Boost".
Have a good day.
-------------------------------------
(MATICBTC 1W chart)

If the price holds above the 0.0000 4151 to 0.0000 4415 range, the upward force is expected to remain.
-------------------------------------
(MATICUSDT 1M Chart)

The question is whether it can break out of the downtrend line by holding the price above 0.7778.
(1W chart)

In order to continue the mid- to long-term upward trend, the key is whether it can rise above 0.8647.
If not, you should check for support around 0.6201.
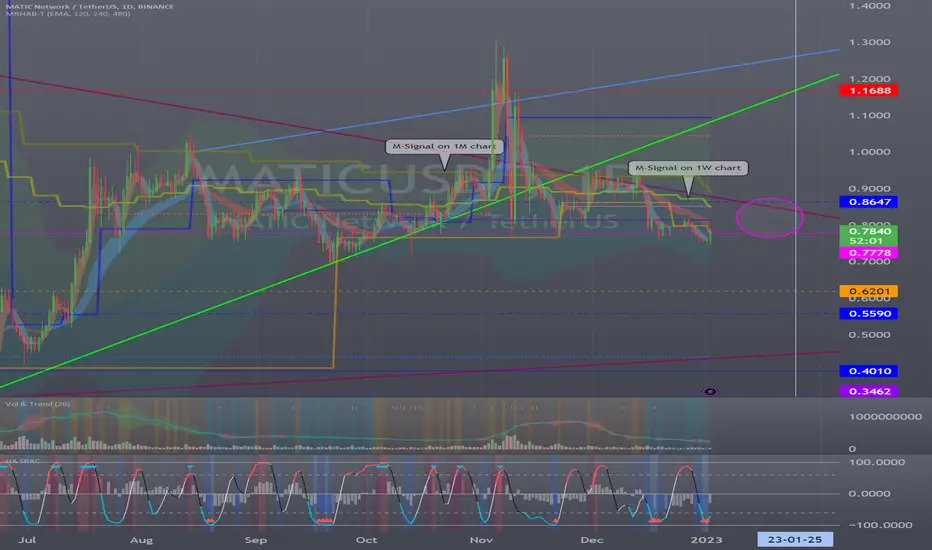
(1D chart)
Since the M-Signal on the 1M chart and the M-Signal on the 1W chart are passing around 0.8647, the important question is whether it can rise above 0.8647.
To do so, it is necessary to check whether it can be supported around 0.7778.
-------------------------------------------------- -------------------------------------------
** All descriptions are for reference only and do not guarantee profit or loss in investment.
** If you share this chart, you can use the indicators normally.
** The MRHAB-T indicator includes indicators that indicate points of support and resistance.
** SR_R_C indicators are displayed as StochRSI (line), RSI (columns), and CCI (bgcolor).
** The CCI indicator is displayed in the overbought section (CCI > +100) and oversold section (CCI < -100).
(Short-term Stop Loss can be said to be a point where profit or loss can be preserved or additional entry can be made by split trading. This is a short-term investment perspective.)
---------------------------------
Traders, welcome.
If you "Follow", you can always get new information quickly.
Please also click "Boost".
Have a good day.
-------------------------------------
(MATICBTC 1W chart)
If the price holds above the 0.0000 4151 to 0.0000 4415 range, the upward force is expected to remain.
-------------------------------------
(MATICUSDT 1M Chart)
The question is whether it can break out of the downtrend line by holding the price above 0.7778.
(1W chart)
In order to continue the mid- to long-term upward trend, the key is whether it can rise above 0.8647.
If not, you should check for support around 0.6201.
(1D chart)
Since the M-Signal on the 1M chart and the M-Signal on the 1W chart are passing around 0.8647, the important question is whether it can rise above 0.8647.
To do so, it is necessary to check whether it can be supported around 0.7778.
-------------------------------------------------- -------------------------------------------
** All descriptions are for reference only and do not guarantee profit or loss in investment.
** If you share this chart, you can use the indicators normally.
** The MRHAB-T indicator includes indicators that indicate points of support and resistance.
** SR_R_C indicators are displayed as StochRSI (line), RSI (columns), and CCI (bgcolor).
** The CCI indicator is displayed in the overbought section (CCI > +100) and oversold section (CCI < -100).
(Short-term Stop Loss can be said to be a point where profit or loss can be preserved or additional entry can be made by split trading. This is a short-term investment perspective.)
---------------------------------
Other content (coins, stocks, etc.) is frequently posted on X.
X에 다른 내용(코인, 주식 등)이 자주 게시.
◆ t.me/readCryptoChannel
[HA-MS Indicator]
bit.ly/3YxHgvN
[OBV Indicator]
bit.ly/4dcyny3
X에 다른 내용(코인, 주식 등)이 자주 게시.
◆ t.me/readCryptoChannel
[HA-MS Indicator]
bit.ly/3YxHgvN
[OBV Indicator]
bit.ly/4dcyny3
Related publications
Disclaimer
The information and publications are not meant to be, and do not constitute, financial, investment, trading, or other types of advice or recommendations supplied or endorsed by TradingView. Read more in the Terms of Use.