Long
MATICUSDT🚀 Will there be a breakdown?!
Subscribe to the channel for more new information about trading✅
Hello everyone👋
Let's analyze the MATIC chart
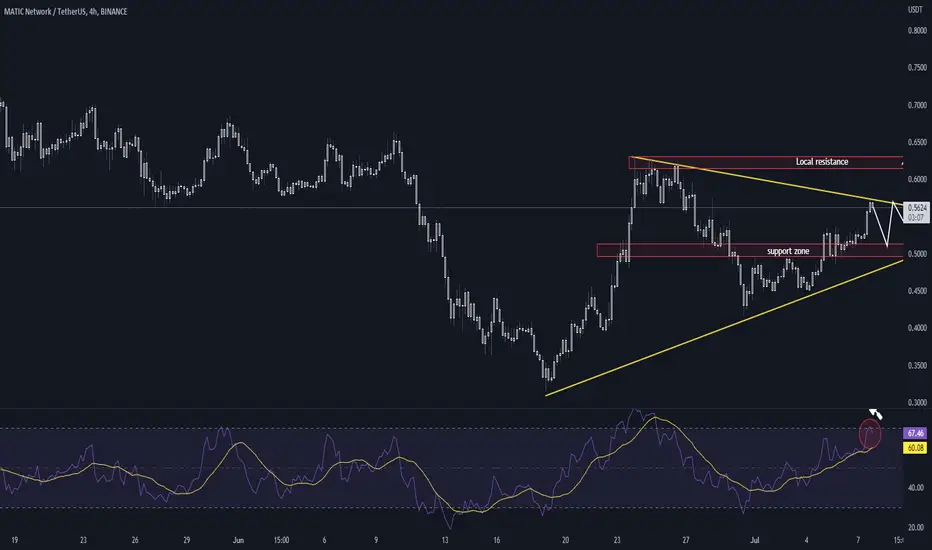
Let's start right away with the RSI indicator, it can be seen that according to the chart we are in the overbought zone, which means that a rollback will follow soon and I think a scalp can turn out to be not bad in the $0.5360 zone😅
We see a certain triangle on the chart where the price is testing the upper border of the pattern, of course, it is inevitable that a breakdown will follow and the price may immediately fly to the local resistance. Well, there is another scenario with a false breakout of the triangle, and again to the support retest and from there already gain a position in LONG (22%)
Hello everyone👋
Let's analyze the MATIC chart
Let's start right away with the RSI indicator, it can be seen that according to the chart we are in the overbought zone, which means that a rollback will follow soon and I think a scalp can turn out to be not bad in the $0.5360 zone😅
We see a certain triangle on the chart where the price is testing the upper border of the pattern, of course, it is inevitable that a breakdown will follow and the price may immediately fly to the local resistance. Well, there is another scenario with a false breakout of the triangle, and again to the support retest and from there already gain a position in LONG (22%)
RU TELEGRAM:t.me/+nJU6W2gATIZlZjky
Disclaimer
The information and publications are not meant to be, and do not constitute, financial, investment, trading, or other types of advice or recommendations supplied or endorsed by TradingView. Read more in the Terms of Use.
RU TELEGRAM:t.me/+nJU6W2gATIZlZjky
Disclaimer
The information and publications are not meant to be, and do not constitute, financial, investment, trading, or other types of advice or recommendations supplied or endorsed by TradingView. Read more in the Terms of Use.