Long
MATIC/USDT Uptrend Take Profit levels 🚀
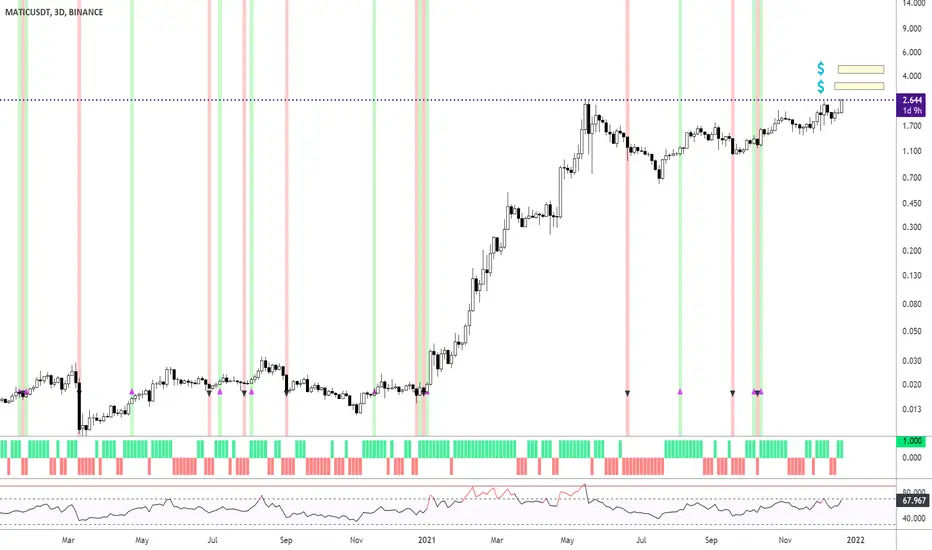
In the chart I am using the Supertrend Ninja indicator, which is a trend-following indicator.
Matic is currently facing resistance from the previous ATH. Break this and we gonna set ourselves some new ATH's. Which on midterm can go as high as 4.8 USDT.
My Take profit levels are in yellow blocks.
On 13th Oct, the background of the candlestick closed green with an upwards pointing pink arrow. Which indicated a possible bullish (up)trend. Since then the price has gone higher. Important detail. The Supertrend Ninja indicator gave only 4 bullish signals for the 3 day chart in 2021.
RSI is close to 70. Break RSI 70, and we might be at the beginning of a bigger uptrend. Heikin Ashi is showing the start of a bullish trend as well (indicator below in the form of green blocks). Do we need to buckle up are seatbelt?
Namasté
Disclaimer: Ideas are for entertainment purposes only. Not financial advice. Your own due diligence is highly advised before entering trades.
Past performance is no guarantee of future returns.
Beware of scammers. I do NOT have Telegram, Discord, Instagram, Twitter, Youtube or Facebook.
Tradingview is the only channel I use.
Tradingview is the only channel I use.
Disclaimer
The information and publications are not meant to be, and do not constitute, financial, investment, trading, or other types of advice or recommendations supplied or endorsed by TradingView. Read more in the Terms of Use.