Long
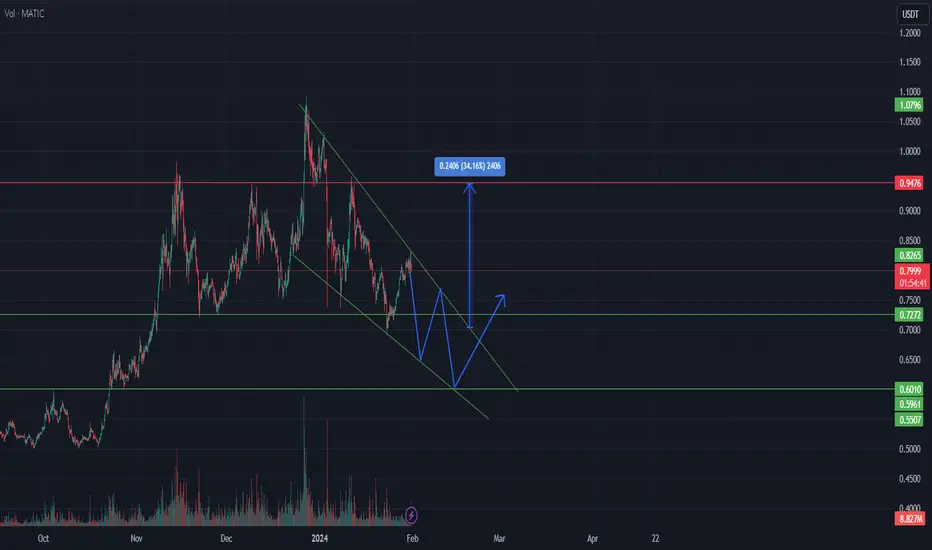
MATICUSDT potential falling wedge
Hi traders,
Let"s take a look at MATIC chart on the 4 hours time frame. It is likely that the price is forming the falling wedge pattern. We expect the price to break out of the pattern. Long position can be taken after the successful breakout. Look for the volume increase in order to avoid trading the false breakout.
Let"s take a look at MATIC chart on the 4 hours time frame. It is likely that the price is forming the falling wedge pattern. We expect the price to break out of the pattern. Long position can be taken after the successful breakout. Look for the volume increase in order to avoid trading the false breakout.
💥 Free signals and ideas ➡ t.me/vfinvestment
Disclaimer
The information and publications are not meant to be, and do not constitute, financial, investment, trading, or other types of advice or recommendations supplied or endorsed by TradingView. Read more in the Terms of Use.
💥 Free signals and ideas ➡ t.me/vfinvestment
Disclaimer
The information and publications are not meant to be, and do not constitute, financial, investment, trading, or other types of advice or recommendations supplied or endorsed by TradingView. Read more in the Terms of Use.