$MATIC forming Head & Shoulder pattern
After a slight rebound,
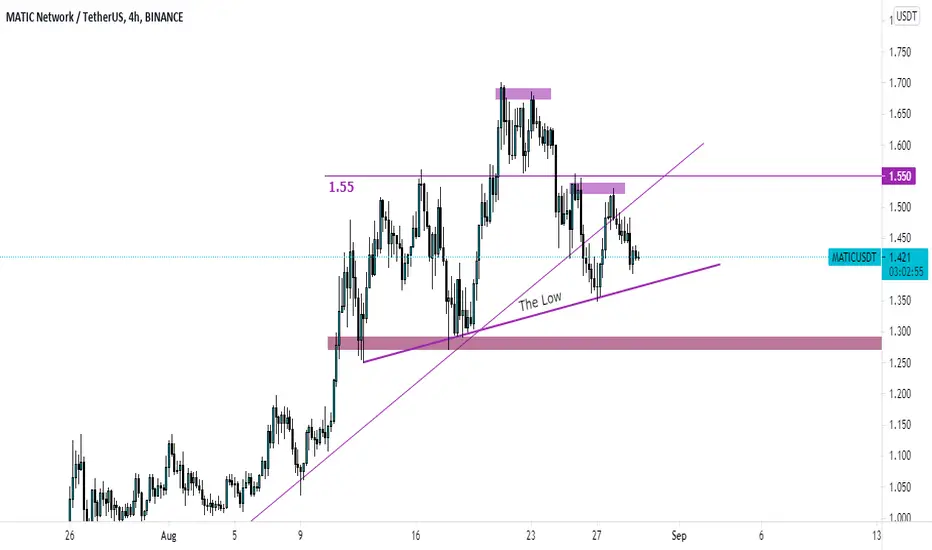
#MATIC reached its resistance zone facing the selling price.
The price seems to form an H&S (head and shoulders) pattern, which is bearish.
Well, until the price does not break below the low (marked in the chart), everything is fine.
Potentially, prices may also rebound from the small trend line.
#MATIC reached its resistance zone facing the selling price.
The price seems to form an H&S (head and shoulders) pattern, which is bearish.
Well, until the price does not break below the low (marked in the chart), everything is fine.
Potentially, prices may also rebound from the small trend line.
iSmashProfit
Related publications
Disclaimer
The information and publications are not meant to be, and do not constitute, financial, investment, trading, or other types of advice or recommendations supplied or endorsed by TradingView. Read more in the Terms of Use.
iSmashProfit
Related publications
Disclaimer
The information and publications are not meant to be, and do not constitute, financial, investment, trading, or other types of advice or recommendations supplied or endorsed by TradingView. Read more in the Terms of Use.