MATICUSDT
Hello Crypto Lovers,
Mars Signals team wishes you high profits.
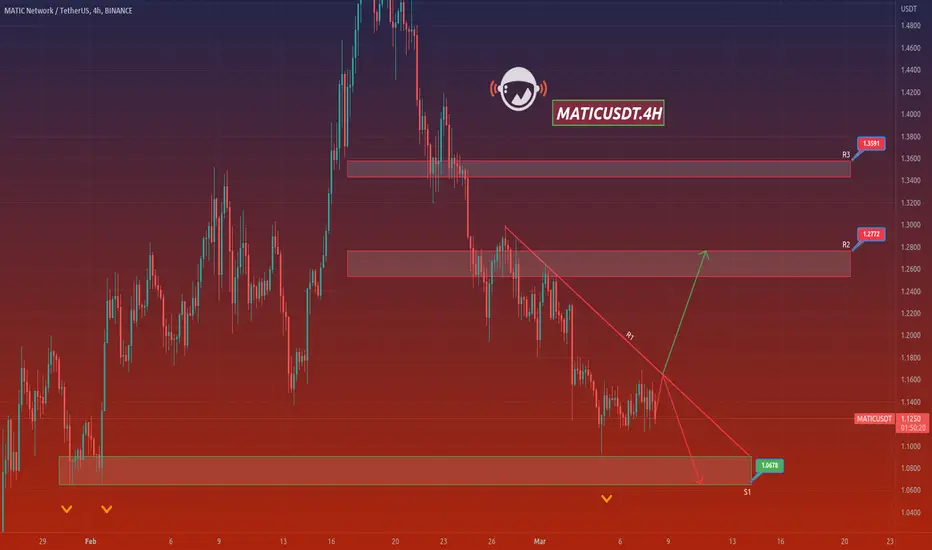
This is a 4-hour-time frame analysis for MATICUSDT
There are R3 and R3 on the top of the chart which used to be support areas. R1 is a resistance area and it represents the unsuccessful triumphs of the price to rise at several points. And as you see, S1 is our long-term support line with the support of price even since the past. At the present, we observe the fluctuation of price below R1. Our expectation would include another rise for the price to reach R1 (as its past behavior) and then via having some rising signs, there would be more rise predicted for the price to reach higher amounts such as R2. It is so probable that the price loses the support at R1 and more decline would happen toward S1. It is crucial to consider the market situation in lower time frames and then decide what to do exactly; based on the multiple pieces of information which you would obtain from our analyses and updates.
Warning: This is just a suggestion and we do not guarantee profits. We advise you to analyze the chart before opening any positions.
Wish you luck
Mars Signals team wishes you high profits.
This is a 4-hour-time frame analysis for MATICUSDT
There are R3 and R3 on the top of the chart which used to be support areas. R1 is a resistance area and it represents the unsuccessful triumphs of the price to rise at several points. And as you see, S1 is our long-term support line with the support of price even since the past. At the present, we observe the fluctuation of price below R1. Our expectation would include another rise for the price to reach R1 (as its past behavior) and then via having some rising signs, there would be more rise predicted for the price to reach higher amounts such as R2. It is so probable that the price loses the support at R1 and more decline would happen toward S1. It is crucial to consider the market situation in lower time frames and then decide what to do exactly; based on the multiple pieces of information which you would obtain from our analyses and updates.
Warning: This is just a suggestion and we do not guarantee profits. We advise you to analyze the chart before opening any positions.
Wish you luck
Disclaimer
The information and publications are not meant to be, and do not constitute, financial, investment, trading, or other types of advice or recommendations supplied or endorsed by TradingView. Read more in the Terms of Use.
Disclaimer
The information and publications are not meant to be, and do not constitute, financial, investment, trading, or other types of advice or recommendations supplied or endorsed by TradingView. Read more in the Terms of Use.