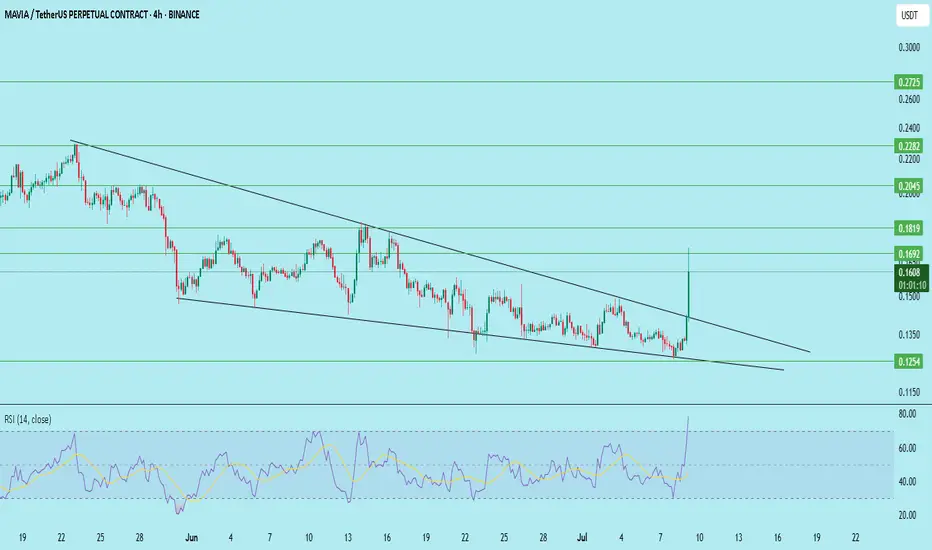
$MAVIA has broken out of a well-defined falling wedge pattern on the 4H chart — a structure known for bullish reversals. The breakout is backed by strong volume and a sharp RSI spike, confirming the bullish momentum.
Key Observations:
Pattern: Falling wedge breakout
Volume: Strong breakout candle with momentum
RSI (14): Currently at 78 — indicating overbought territory
Retest Zone: A pullback toward 0.150–0.155 may offer a better entry
Trade Setup:
Entry: 0.150–0.160
Stop Loss: 0.143 (below wedge support)
Targets: 0.1692, 0.1819, 0.2045, 0.2282, 0.2725
Conclusion:
The breakout looks promising, but RSI suggests short-term cooling. The ideal strategy is to wait for a retest before entering. Keep risk tight as it's early in the breakout phase.
DYOR | Not financial advice
Disclaimer
The information and publications are not meant to be, and do not constitute, financial, investment, trading, or other types of advice or recommendations supplied or endorsed by TradingView. Read more in the Terms of Use.
Disclaimer
The information and publications are not meant to be, and do not constitute, financial, investment, trading, or other types of advice or recommendations supplied or endorsed by TradingView. Read more in the Terms of Use.