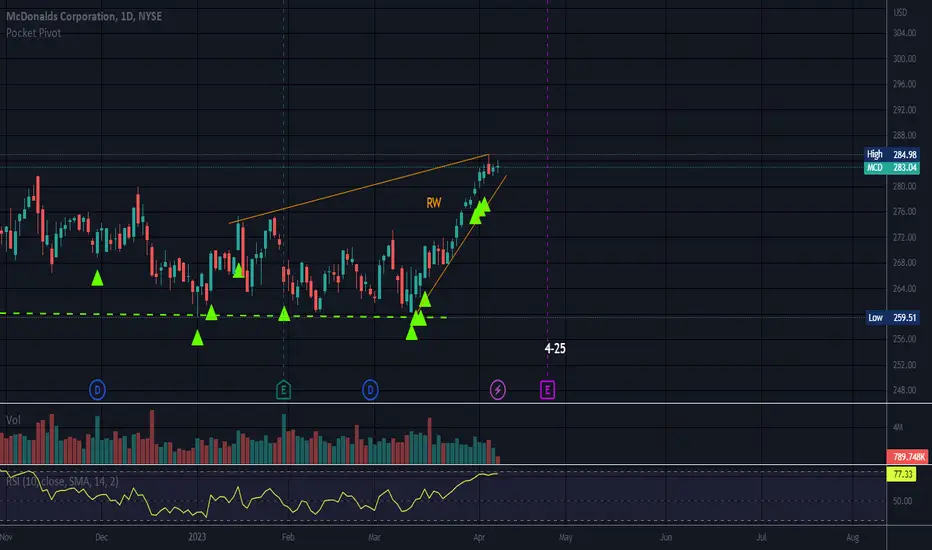
Both trendlines are sloping up and narrowing at the apex which = a rising wedge.
This pattern is not valid until the bottom trendline is broken.
Rising wedges can break up but in the long run they break down and are considered a bearish pattern.
Rising wedges interrupt supply and demand and represent too much supply.
Several spinning tops up there representing indecision.
No recommendation.
Strong stock.
52 Week Range
228.34
284.98
Day Range
281.99
284.17
EPS (FWD)
10.58
PE (FWD)
26.74
Div Rate (FWD)
$6.08
Yield (FWD)
2.15%
Short Interest
0.86%
Market Cap
$206.93B
Disclaimer
The information and publications are not meant to be, and do not constitute, financial, investment, trading, or other types of advice or recommendations supplied or endorsed by TradingView. Read more in the Terms of Use.
Disclaimer
The information and publications are not meant to be, and do not constitute, financial, investment, trading, or other types of advice or recommendations supplied or endorsed by TradingView. Read more in the Terms of Use.