This chart illustrates the multi-decade rhythm of
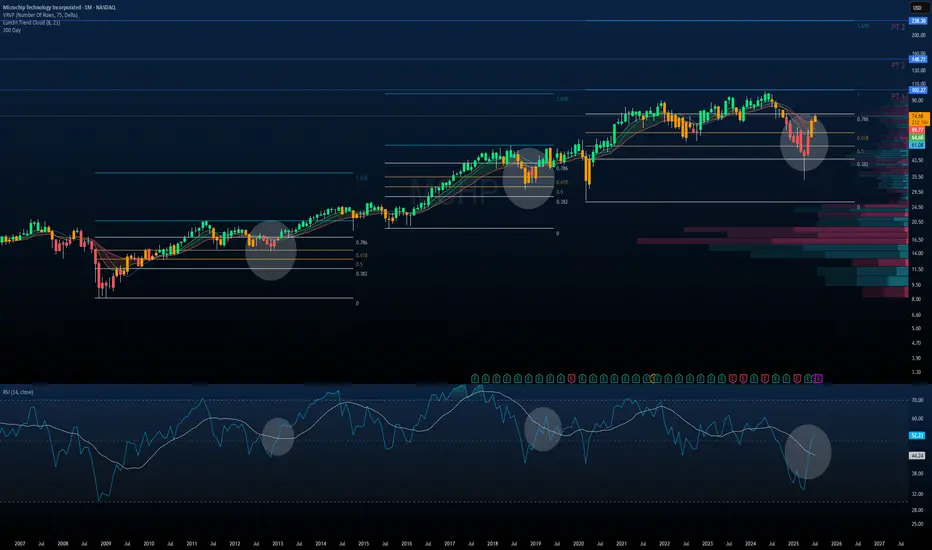
Historical Market Cycles & RSI Trends
Each gray circle marks a key market structure low with:
A bounce from macro Fibonacci retracement zones
A bullish RSI crossover through its signal line (white MA)
A recovery from oversold or mid-40 RSI levels, signaling trend reversal
We’ve now entered the fourth identical cycle dating back to 2009.
Current Technical Structure
Price just bounced off the 0.618–0.786 retracement zone from the 2020–2021 cycle.
Strong reversal candle printing off volume support, reclaiming major EMAs.
RSI is breaking through its signal line, just as it did in 2012, 2016, and 2019 — each of which led to multi-year rallies.
Fibonacci-Based Price Targets
Using prior extensions from similar fractals:
PT1: $102.77 — 1.0 extension of the last impulse
PT2: $148.71
PT3: $238.30
These are not short-term targets, but structural projections if this macro cycle repeats.
Macro Thesis
When price + momentum + Fib structure + RSI rhythm align like this, it usually sets the stage for multi-year compounding upside.
This chart doesn’t predict the future.
It just reminds us the past leaves footprints.
And
Disclaimer
The information and publications are not meant to be, and do not constitute, financial, investment, trading, or other types of advice or recommendations supplied or endorsed by TradingView. Read more in the Terms of Use.
Disclaimer
The information and publications are not meant to be, and do not constitute, financial, investment, trading, or other types of advice or recommendations supplied or endorsed by TradingView. Read more in the Terms of Use.