Daily chart,
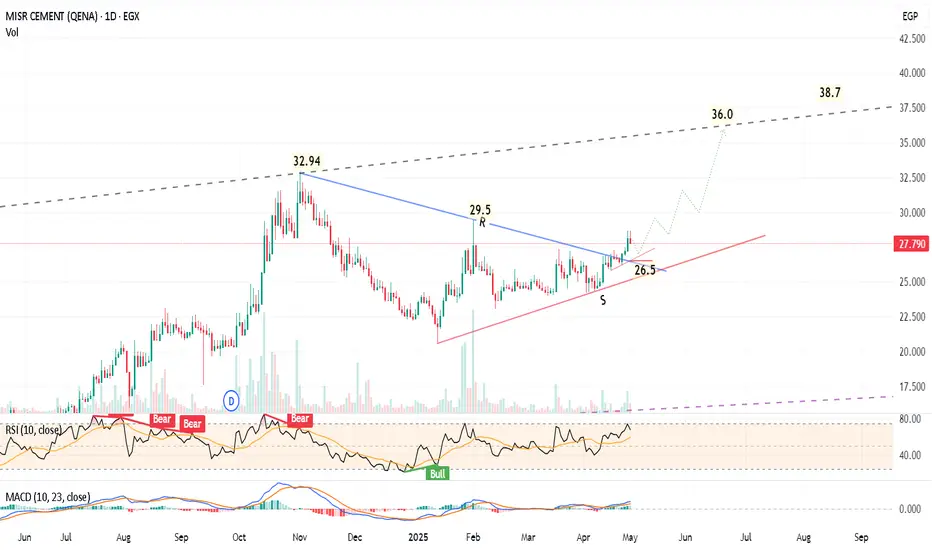
the stock MCQE has formed a triangle chart pattern, and the target is 36.0 then 38.0
29.5 and 32.9 are resistance levels.
Technical indicator MACD is positive and crossed its signal line.
RSI is showing a probability to have a minor correction before resuming the bullish movement.
Closing below 26.5 - 26.0 for 2 days should be a stop loss level on the daily time frame.
Note: New buy entry after 28.8 (2 days close) or around the support zone 26.5 - 26.0
the stock
29.5 and 32.9 are resistance levels.
Technical indicator MACD is positive and crossed its signal line.
RSI is showing a probability to have a minor correction before resuming the bullish movement.
Closing below 26.5 - 26.0 for 2 days should be a stop loss level on the daily time frame.
Note: New buy entry after 28.8 (2 days close) or around the support zone 26.5 - 26.0
Trade active
Latest jump in one day 13% !!Trade closed: target reached
1st target reached.I expect a minor cool down before hitting the next target.
Disclaimer
The information and publications are not meant to be, and do not constitute, financial, investment, trading, or other types of advice or recommendations supplied or endorsed by TradingView. Read more in the Terms of Use.
Disclaimer
The information and publications are not meant to be, and do not constitute, financial, investment, trading, or other types of advice or recommendations supplied or endorsed by TradingView. Read more in the Terms of Use.