Price Levels and Key Zones:
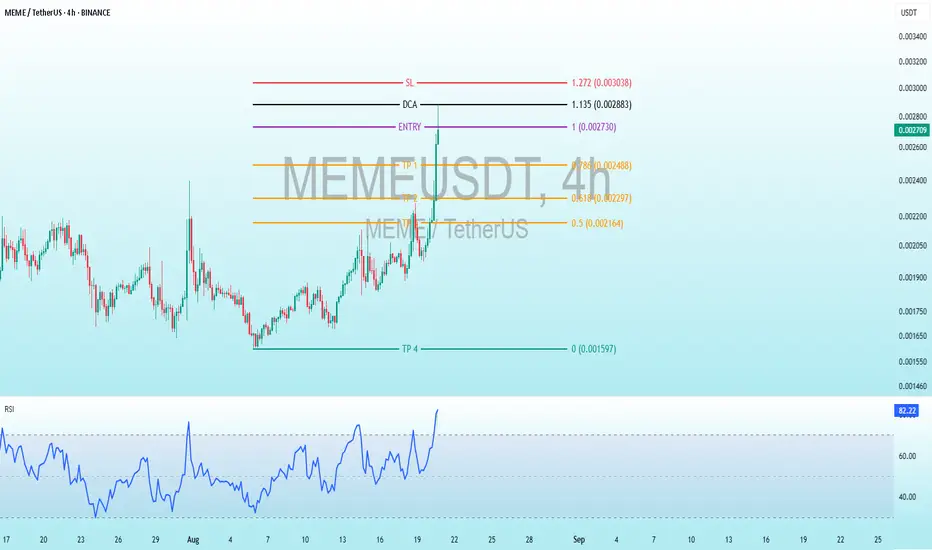
Entry: 1.00 (0.002730 USDT) - Identified as a potential entry point for a trade.
DCA (Dollar Cost Averaging): 1.135 (0.002883 USDT) - A level for averaging the cost if the price drops.
SL (Stop Loss): 1.272 (0.003036 USDT) - A stop-loss level to protect the investment.
TP (Take Profit) Levels:TP1: 0.476 (0.002448 USDT)
TP2: 0.618 (0.002297 USDT)
TP3: 0.5 (0.002164 USDT)
TP4: 0 (0.001597 USDT) - An unusually low target, possibly a typo or a theoretical minimum.
Trend and Price Movements:
The chart shows a sharp upward spike around August 7-10, reaching a local peak.
Following this, there has been a gradual decline with minor fluctuations, stabilizing near the entry level (1.00).
A recent uptick is visible, suggesting potential momentum as of the latest data point at 6:36 PM CEST on August 20, 2025.
RSI (Relative Strength Index):
The RSI is currently at 82.39, indicating that MEME is in overbought territory (above 70), which may suggest a potential reversal or correction in the near future unless supported by strong buying pressure.
Observations:
The chart includes a trading strategy with defined entry, stop-loss, and take-profit levels, likely created by a user (AltcoinPioneers) using TradingView.
The price action shows volatility, typical of meme coins, with significant price swings.
✅MY Free Signals Telegram
t.me/AltcoinPiooners
✅Personal Telegram (Premium)
t.me/Altcoin_Piooners
✅YouTube
youtube.com/@AltcoinPiooners
t.me/AltcoinPiooners
✅Personal Telegram (Premium)
t.me/Altcoin_Piooners
✅YouTube
youtube.com/@AltcoinPiooners
Disclaimer
The information and publications are not meant to be, and do not constitute, financial, investment, trading, or other types of advice or recommendations supplied or endorsed by TradingView. Read more in the Terms of Use.