Chart Breakdown: MES1! & MNQ1! – 4H Timeframe Analysis by GOAT
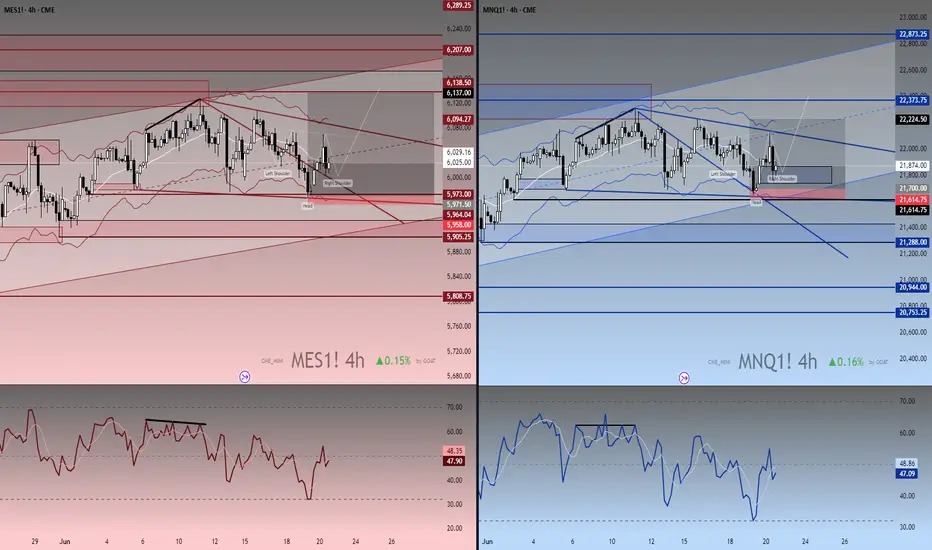
This dual-pane chart presents a detailed technical analysis of the E-mini S&P 500 Futures (MES1!) and Micro Nasdaq Futures (MNQ1!) on the 4-hour timeframe, designed with a custom visual aesthetic and proprietary tools by GOAT.
🔺 Left Panel – MES1! (4H):
Price Action: MES is trading within a broad rising channel, currently testing key support near 6,020 after a textbook Head and Shoulders formation.
Overlays: A dynamic channel structure and multiple Fibonacci-like zone levels guide potential bounce or breakdown scenarios.
Bearish Divergence: RSI shows clear bearish divergence leading into the recent highs—highlighted with trendline markers.
Support Zones: Immediate support around 5,973, with deeper support levels around 5,905 and 5,808 if breakdown confirms.
🔵 Right Panel – MNQ1! (4H):
Structure: MNQ is also respecting a broader bullish channel with intermediate pullbacks. Current structure shows an active Inverse Head and Shoulders setup with a neckline breakout possible above 21,930.
Trade Markups: An active long trade is visible with entry, stop-loss, and take-profit zones marked (+784 ticks risk, +4,220 ticks potential reward).
Dynamic Zones: Blue channel and volume-weighted zones provide a context for supply/demand imbalances.
Momentum: RSI recovering from oversold territory with signs of early bullish reversion.
📉 Bottom Pane – RSI Comparison:
MES RSI (Left): Bearish divergence structure leading to local weakness; neutral at ~47.
MNQ RSI (Right): Bullish rebound attempt with higher low in RSI compared to price, suggesting a possible positive divergence.
🧠 Summary:
This setup highlights potential short-term bullish reversals on MNQ1! and trend exhaustion on MES1! using classic pattern recognition (H&S and inverse H&S), custom channel tools, and momentum divergences. Ideal for traders watching high-probability inflection points on U.S. index futures.
⚙️ Designed for educational purposes. Not financial advice.
Disclaimer
The information and publications are not meant to be, and do not constitute, financial, investment, trading, or other types of advice or recommendations supplied or endorsed by TradingView. Read more in the Terms of Use.
Disclaimer
The information and publications are not meant to be, and do not constitute, financial, investment, trading, or other types of advice or recommendations supplied or endorsed by TradingView. Read more in the Terms of Use.