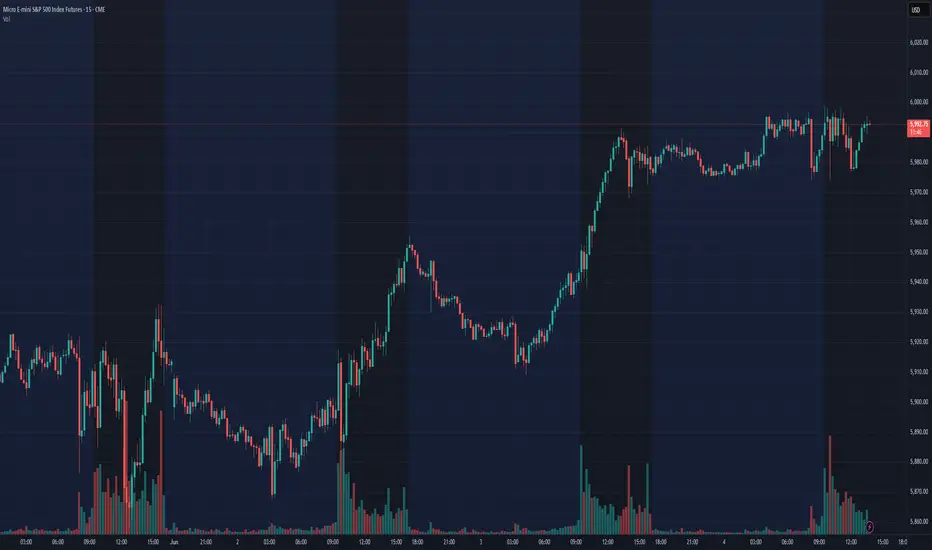
Technical analysis of the S&P 500 Index using market structure, key support and resistance zones, and price action confirmation.
This chart includes my current bias based on breakout-retest-confirmation setups, ideal for intraday and swing trading perspective.
Updated regularly to reflect institutional activity and liquidity zones.
This chart includes my current bias based on breakout-retest-confirmation setups, ideal for intraday and swing trading perspective.
Updated regularly to reflect institutional activity and liquidity zones.
Disclaimer
The information and publications are not meant to be, and do not constitute, financial, investment, trading, or other types of advice or recommendations supplied or endorsed by TradingView. Read more in the Terms of Use.
Disclaimer
The information and publications are not meant to be, and do not constitute, financial, investment, trading, or other types of advice or recommendations supplied or endorsed by TradingView. Read more in the Terms of Use.