Analysis:
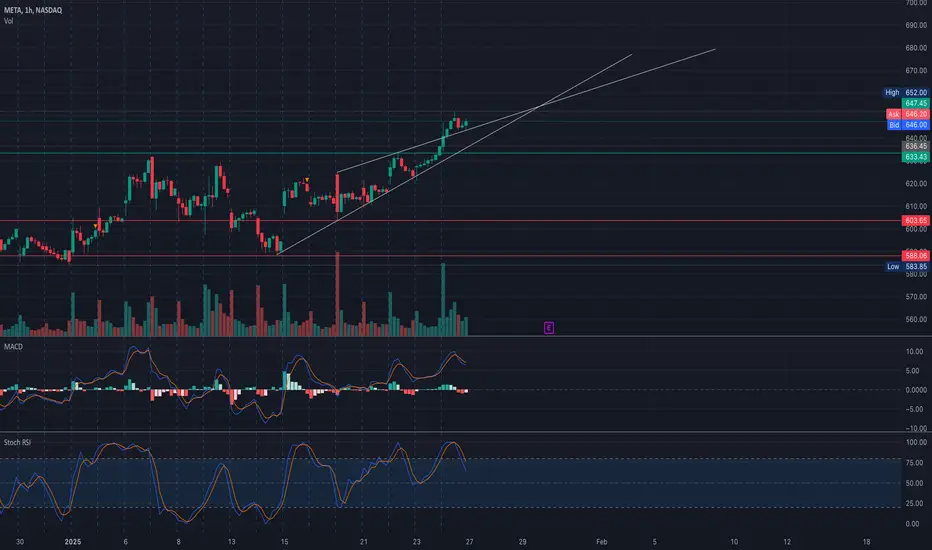
Meta Platforms (META) has seen a strong upward move and is now trading close to a critical resistance zone near $650. The price action and gamma levels suggest a potential continuation or retracement scenario.
Technical Observations:
1. Trend Analysis:
* META is in a clear uptrend, supported by higher highs and higher lows.
* The price is forming a rising wedge, indicating potential bullish momentum but also a risk of reversal if key levels are breached.
2. Key Levels:
* Resistance: $652 (recent high and 3rd call wall), $700 (highest GEX/call resistance).
* Support: $633.43 (immediate support), $603.65 (major support level and put gamma wall), $580 (next key level).
3. Indicators:
* MACD: Currently showing slight bearish divergence, signaling potential short-term weakness.
* Stochastic RSI: Approaching overbought territory, suggesting caution for longs.
4. Volume Profile:
* Increased buying volume during the recent rally indicates strong bullish interest but may slow as META nears resistance.
GEX Insights:
1. Call Walls:
* Key Call Levels: $652 (3rd call wall) and $700 (highest positive GEX and gamma resistance). Breaching $652 could open the path to $700.
2. Put Walls:
* Key Put Levels: $603.65 (strong support zone) and $580 (next major support).
3. IVR and Options Activity:
* IVR: 43.5 (slightly above average volatility).
* Options Flow: Call volume dominates with a 29.9% skew, reinforcing bullish sentiment.
Trade Scenarios:
Bullish Scenario:
* Entry: Break above $652 with strong volume.
* Target: $680 (intermediate resistance) and $700 (long-term target).
* Stop-Loss: Below $640 to limit downside risk.
Bearish Scenario:
* Entry: Rejection at $650-$652.
* Target: $633.43 (immediate support) and $603.65 (key support).
* Stop-Loss: Above $655 to minimize losses.
Actionable Suggestions:
* Closely watch price action around $650-$652. A breakout could accelerate upward momentum, while rejection signals a pullback.
* Monitor options flow for shifts in sentiment, particularly near $652 and $700.
* Be cautious of overbought signals from the Stochastic RSI when considering long positions.
Disclaimer: This analysis is for educational purposes only and does not constitute financial advice. Always do your own research and manage your risk before trading.
Disclaimer
The information and publications are not meant to be, and do not constitute, financial, investment, trading, or other types of advice or recommendations supplied or endorsed by TradingView. Read more in the Terms of Use.
Disclaimer
The information and publications are not meant to be, and do not constitute, financial, investment, trading, or other types of advice or recommendations supplied or endorsed by TradingView. Read more in the Terms of Use.