Technical Analysis Overview:
1-Hour Chart:
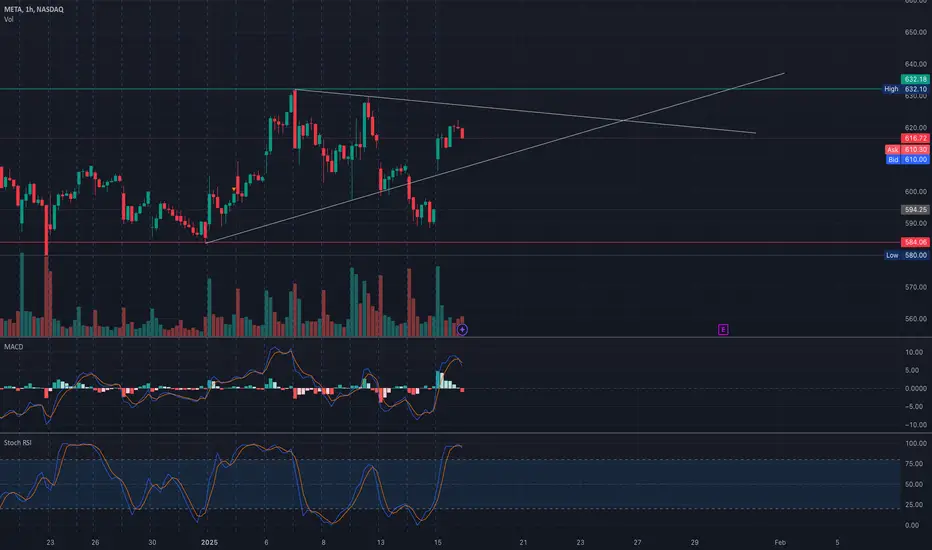
* Trend: META is consolidating near $610 after rebounding from $588 support.
* Indicators:
* MACD: Displays bearish momentum, with a potential signal line crossover.
* Stochastic RSI: Overbought, suggesting a possible short-term pullback.
30-Minute Chart:
* Price Action:
* META faces resistance at $615, with immediate support near $600.
* A symmetrical triangle pattern hints at a potential breakout or breakdown depending on momentum.
Key Levels to Watch:
Support Levels:
* $600: Immediate support zone, marked by the HVL.
* $595: Strong PUT support (-4.64% GEX).
* $587.5: 2nd PUT Wall support (-2.31% GEX).
Resistance Levels:
* $615: Key resistance level and 2nd CALL Wall.
* $625: Next resistance, aligning with GEX10.
* $630-$634: Major resistance zone, including the highest positive NETGEX.
GEX Insights:

Key Gamma Levels:
* Positive Gamma Walls (Resistance):
* $615: 29.87% GEX (2nd CALL Wall).
* $625: 25.43% GEX (GEX10).
* $634: Highest positive NETGEX and CALL resistance.
* Negative Gamma Levels (Support):
* $595: Key PUT support (-4.64% GEX).
* $587.5: Significant PUT Wall (-2.31% GEX).
Options Metrics:
* IVR: 52.5, indicating moderate implied volatility.
* IVx: 45.1, near average levels.
* Call/Put Bias: Calls dominate at 29.3%, reflecting bullish sentiment.
Trade Scenarios:
Bullish Scenario:
* Entry: Above $615 with strong volume.
* Target: $625-$630.
* Stop-Loss: Below $600 to manage risk.
Bearish Scenario:
* Entry: Rejection at $615 or breakdown below $600.
* Target: $595-$587.5.
* Stop-Loss: Above $620 to limit losses.
Directional Bias:
* META’s consolidation near $610 suggests a pause before the next move. A breakout above $615 could signal bullish continuation, while failure to hold $600 may lead to a retest of lower levels.
Conclusion:
META is trading near a critical resistance zone at $615. Bulls need strong momentum to push toward $625-$630, while bears will aim to defend this level. Watch for volume confirmation and key gamma levels for actionable setups.
Disclaimer: This analysis is for educational purposes only and does not constitute financial advice. Always conduct your research and trade responsibly.
1-Hour Chart:
* Trend: META is consolidating near $610 after rebounding from $588 support.
* Indicators:
* MACD: Displays bearish momentum, with a potential signal line crossover.
* Stochastic RSI: Overbought, suggesting a possible short-term pullback.
30-Minute Chart:
* Price Action:
* META faces resistance at $615, with immediate support near $600.
* A symmetrical triangle pattern hints at a potential breakout or breakdown depending on momentum.
Key Levels to Watch:
Support Levels:
* $600: Immediate support zone, marked by the HVL.
* $595: Strong PUT support (-4.64% GEX).
* $587.5: 2nd PUT Wall support (-2.31% GEX).
Resistance Levels:
* $615: Key resistance level and 2nd CALL Wall.
* $625: Next resistance, aligning with GEX10.
* $630-$634: Major resistance zone, including the highest positive NETGEX.
GEX Insights:
Key Gamma Levels:
* Positive Gamma Walls (Resistance):
* $615: 29.87% GEX (2nd CALL Wall).
* $625: 25.43% GEX (GEX10).
* $634: Highest positive NETGEX and CALL resistance.
* Negative Gamma Levels (Support):
* $595: Key PUT support (-4.64% GEX).
* $587.5: Significant PUT Wall (-2.31% GEX).
Options Metrics:
* IVR: 52.5, indicating moderate implied volatility.
* IVx: 45.1, near average levels.
* Call/Put Bias: Calls dominate at 29.3%, reflecting bullish sentiment.
Trade Scenarios:
Bullish Scenario:
* Entry: Above $615 with strong volume.
* Target: $625-$630.
* Stop-Loss: Below $600 to manage risk.
Bearish Scenario:
* Entry: Rejection at $615 or breakdown below $600.
* Target: $595-$587.5.
* Stop-Loss: Above $620 to limit losses.
Directional Bias:
* META’s consolidation near $610 suggests a pause before the next move. A breakout above $615 could signal bullish continuation, while failure to hold $600 may lead to a retest of lower levels.
Conclusion:
META is trading near a critical resistance zone at $615. Bulls need strong momentum to push toward $625-$630, while bears will aim to defend this level. Watch for volume confirmation and key gamma levels for actionable setups.
Disclaimer: This analysis is for educational purposes only and does not constitute financial advice. Always conduct your research and trade responsibly.
Disclaimer
The information and publications are not meant to be, and do not constitute, financial, investment, trading, or other types of advice or recommendations supplied or endorsed by TradingView. Read more in the Terms of Use.
Disclaimer
The information and publications are not meant to be, and do not constitute, financial, investment, trading, or other types of advice or recommendations supplied or endorsed by TradingView. Read more in the Terms of Use.