📊 Chart Analysis: META Platforms (META), 30-Minute Timeframe
🧠 Thesis Summary:
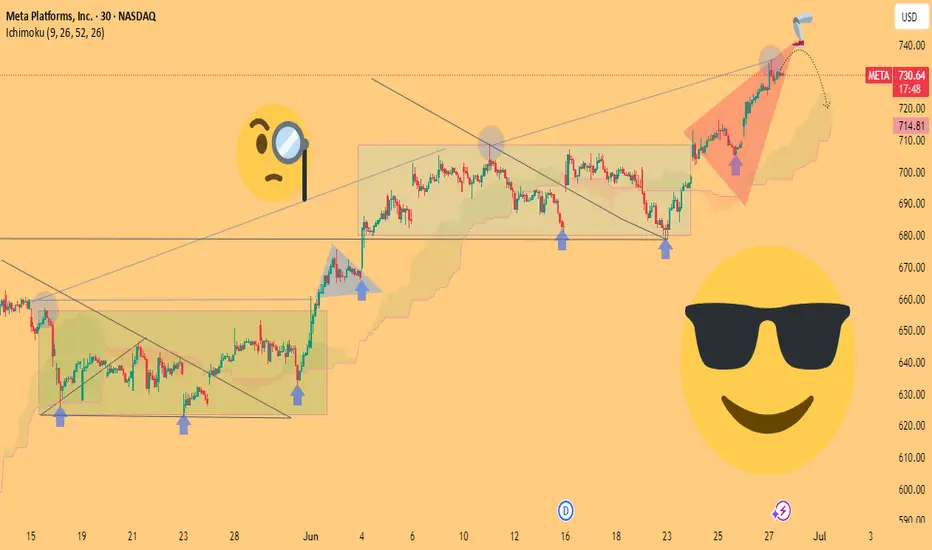
The META chart shows a clear progression of bullish continuation patterns followed by potential exhaustion at the top of a rising wedge. A short-term retracement appears likely, offering a tactical opportunity for traders eyeing mean reversion setups.
---
🔍 Technical Breakdown:
1. Chart Patterns Identified:
Rectangles (Consolidation Zones):
Price respected horizontal support/resistance within multiple sideways ranges, indicating accumulation/distribution phases.
Marked with green boxes and blue arrows, the breakout points signal strong bullish momentum.
Symmetrical Triangle Breakout:
Just before the sharp rally, a textbook symmetrical triangle broke to the upside, acting as a bullish continuation.
Volume and price action confirmed this breakout.
Rising Wedge (Potential Reversal):
Price currently sits within a rising wedge (highlighted in red), often a bearish reversal pattern.
The curved dashed line suggests a projected pullback, possibly toward the Ichimoku Cloud (around $715–$720).
---
2. Ichimoku Cloud Analysis:
Supportive Trend Confirmation:
Price remained above the cloud for most of the move, reinforcing bullish bias.
Cloud thickness is reducing ahead, implying a potential slowdown in momentum.
---
3. Projected Path:
A short-term correction is projected as the price tests the upper boundary of the wedge.
A return toward the support zone ($715–$720) aligns with both technical pattern resolution and cloud support.
---
😎 What Makes This Chart Stand Out:
✅ Unique Visual Storytelling:
The use of emojis and illustrations (e.g., magnifying glass, sunglasses) adds personality while guiding the viewer’s eye to critical points.
The projected price path with curved lines and clear highlight zones communicates the author’s idea visually—ideal for broader engagement.
✅ Depth of Analysis:
Combines chart patterns, Ichimoku Cloud, trendlines, and price structure analysis.
Progression from consolidation to breakout to exhaustion is clearly defined and educational.
✅ Clean and Professional Layout:
No clutter—colors are subtle and harmonized.
Annotations are purposeful and add meaning rather than noise.
---
📌 Conclusion / Idea for TradingView Title:
> "META on the Move: From Breakout to Blow-Off – Is a Pullback Next?"
A high-conviction technical setup with a rising wedge near exhaustion, supported by Ichimoku analysis. Watch for a pullback to $715–$720 before the next move.
---
🧰 Tips for Publishing:
Use a short, sharp headline that teases the idea.
Include a brief written summary under the chart explaining your logic—something like what’s outlined above.
🧠 Thesis Summary:
The META chart shows a clear progression of bullish continuation patterns followed by potential exhaustion at the top of a rising wedge. A short-term retracement appears likely, offering a tactical opportunity for traders eyeing mean reversion setups.
---
🔍 Technical Breakdown:
1. Chart Patterns Identified:
Rectangles (Consolidation Zones):
Price respected horizontal support/resistance within multiple sideways ranges, indicating accumulation/distribution phases.
Marked with green boxes and blue arrows, the breakout points signal strong bullish momentum.
Symmetrical Triangle Breakout:
Just before the sharp rally, a textbook symmetrical triangle broke to the upside, acting as a bullish continuation.
Volume and price action confirmed this breakout.
Rising Wedge (Potential Reversal):
Price currently sits within a rising wedge (highlighted in red), often a bearish reversal pattern.
The curved dashed line suggests a projected pullback, possibly toward the Ichimoku Cloud (around $715–$720).
---
2. Ichimoku Cloud Analysis:
Supportive Trend Confirmation:
Price remained above the cloud for most of the move, reinforcing bullish bias.
Cloud thickness is reducing ahead, implying a potential slowdown in momentum.
---
3. Projected Path:
A short-term correction is projected as the price tests the upper boundary of the wedge.
A return toward the support zone ($715–$720) aligns with both technical pattern resolution and cloud support.
---
😎 What Makes This Chart Stand Out:
✅ Unique Visual Storytelling:
The use of emojis and illustrations (e.g., magnifying glass, sunglasses) adds personality while guiding the viewer’s eye to critical points.
The projected price path with curved lines and clear highlight zones communicates the author’s idea visually—ideal for broader engagement.
✅ Depth of Analysis:
Combines chart patterns, Ichimoku Cloud, trendlines, and price structure analysis.
Progression from consolidation to breakout to exhaustion is clearly defined and educational.
✅ Clean and Professional Layout:
No clutter—colors are subtle and harmonized.
Annotations are purposeful and add meaning rather than noise.
---
📌 Conclusion / Idea for TradingView Title:
> "META on the Move: From Breakout to Blow-Off – Is a Pullback Next?"
A high-conviction technical setup with a rising wedge near exhaustion, supported by Ichimoku analysis. Watch for a pullback to $715–$720 before the next move.
---
🧰 Tips for Publishing:
Use a short, sharp headline that teases the idea.
Include a brief written summary under the chart explaining your logic—something like what’s outlined above.
Join telegram channel free ..
t.me/+zOlIssFOXrtlNWE0
Forex, Gold & Crypto Signals with detailed analysis & get consistent results..
Gold Signal's with proper TP & SL for high profit ..
t.me/+zOlIssFOXrtlNWE0
t.me/+zOlIssFOXrtlNWE0
Forex, Gold & Crypto Signals with detailed analysis & get consistent results..
Gold Signal's with proper TP & SL for high profit ..
t.me/+zOlIssFOXrtlNWE0
Disclaimer
The information and publications are not meant to be, and do not constitute, financial, investment, trading, or other types of advice or recommendations supplied or endorsed by TradingView. Read more in the Terms of Use.