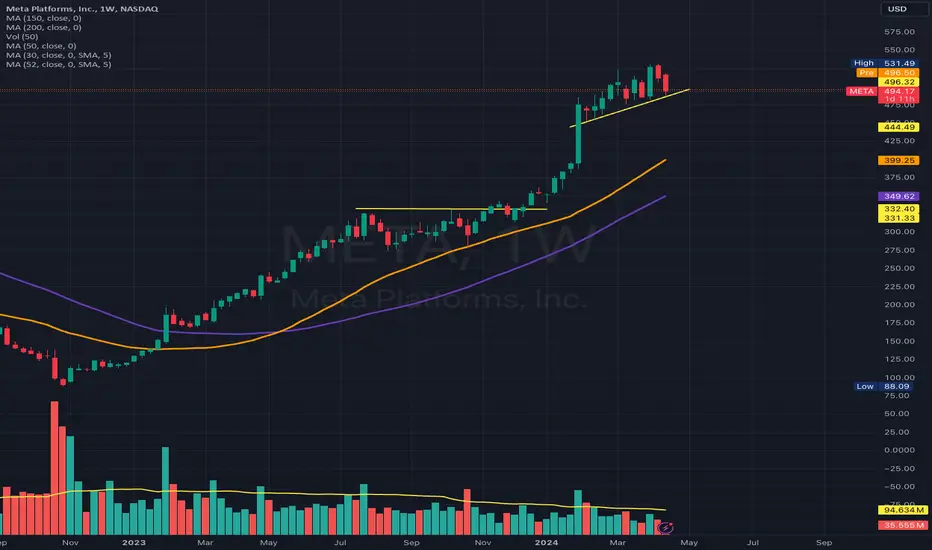
As of April 17, 2024,  META is trading right at the yellow trendline as shown on the chart.
A breakdown below this trendline would suggest further decline another 8%, to around $450
A breakdown below this trendline would suggest further decline another 8%, to around $450
Note
The stock closed down below the trendline which is a sell signal.Disclaimer
The information and publications are not meant to be, and do not constitute, financial, investment, trading, or other types of advice or recommendations supplied or endorsed by TradingView. Read more in the Terms of Use.
Disclaimer
The information and publications are not meant to be, and do not constitute, financial, investment, trading, or other types of advice or recommendations supplied or endorsed by TradingView. Read more in the Terms of Use.