Meta Platforms (META) Shares Decline Amid AI Concerns
Shares of US tech giant Meta Platforms (META) fell by around 3% after media reports revealed that the company plans to reorganise its artificial intelligence operations for the fourth time in six months. The news has raised investor concerns over whether Meta’s AI strategy is on the right track.
Meanwhile, Bloomberg reports that Meta intends to begin selling its first smart glasses with a built-in display next month. However, the price may come in lower than expected — at $800 — as the company is willing to accept slimmer margins to stimulate demand (and, consequently, lower its profit outlook).

Technical Analysis of META Stock
In our previous analysis of META’s chart, we outlined an ascending channel and suggested that the bulls might attempt to push the price higher within this structure, supported by strong fundamentals following the company’s quarterly earnings release.
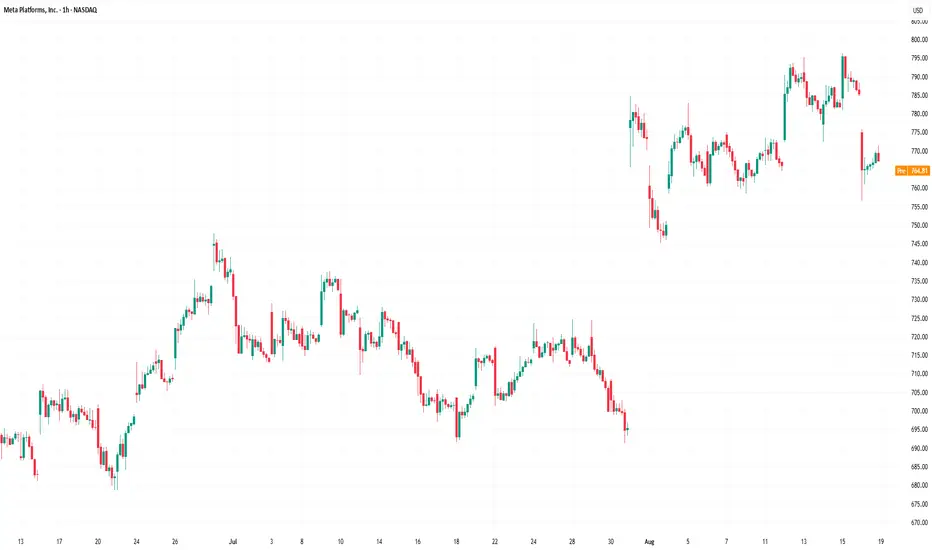
Since then, the price has climbed to new record highs (with the all-time peak now above $790). However, the technical outlook appears uncertain, with several bearish signals emerging:
→ Selling pressure may arise around the psychological $800 level.
→ The upper boundary of the channel is acting as resistance, and the price has formed a bearish double top pattern (as indicated by the arrows).
→ A bearish gap (highlighted in orange) may also act as an obstacle to further upward movement.
Additionally, adding an intermediate ascending trendline to the chart reveals the formation of a bearish rising wedge pattern.
At present, the price is hovering around the channel’s median line, but given the above factors, we could assume that the balance could shift in favour of the bears. In this case, META’s share price may undergo a significant correction.
Should this scenario unfold, the bulls could become active again around the support level at $747 or at the lower boundary of the channel.
This article represents the opinion of the Companies operating under the FXOpen brand only. It is not to be construed as an offer, solicitation, or recommendation with respect to products and services provided by the Companies operating under the FXOpen brand, nor is it to be considered financial advice.
Shares of US tech giant Meta Platforms (META) fell by around 3% after media reports revealed that the company plans to reorganise its artificial intelligence operations for the fourth time in six months. The news has raised investor concerns over whether Meta’s AI strategy is on the right track.
Meanwhile, Bloomberg reports that Meta intends to begin selling its first smart glasses with a built-in display next month. However, the price may come in lower than expected — at $800 — as the company is willing to accept slimmer margins to stimulate demand (and, consequently, lower its profit outlook).
Technical Analysis of META Stock
In our previous analysis of META’s chart, we outlined an ascending channel and suggested that the bulls might attempt to push the price higher within this structure, supported by strong fundamentals following the company’s quarterly earnings release.
Since then, the price has climbed to new record highs (with the all-time peak now above $790). However, the technical outlook appears uncertain, with several bearish signals emerging:
→ Selling pressure may arise around the psychological $800 level.
→ The upper boundary of the channel is acting as resistance, and the price has formed a bearish double top pattern (as indicated by the arrows).
→ A bearish gap (highlighted in orange) may also act as an obstacle to further upward movement.
Additionally, adding an intermediate ascending trendline to the chart reveals the formation of a bearish rising wedge pattern.
At present, the price is hovering around the channel’s median line, but given the above factors, we could assume that the balance could shift in favour of the bears. In this case, META’s share price may undergo a significant correction.
Should this scenario unfold, the bulls could become active again around the support level at $747 or at the lower boundary of the channel.
This article represents the opinion of the Companies operating under the FXOpen brand only. It is not to be construed as an offer, solicitation, or recommendation with respect to products and services provided by the Companies operating under the FXOpen brand, nor is it to be considered financial advice.
Disclaimer
The information and publications are not meant to be, and do not constitute, financial, investment, trading, or other types of advice or recommendations supplied or endorsed by TradingView. Read more in the Terms of Use.
Disclaimer
The information and publications are not meant to be, and do not constitute, financial, investment, trading, or other types of advice or recommendations supplied or endorsed by TradingView. Read more in the Terms of Use.