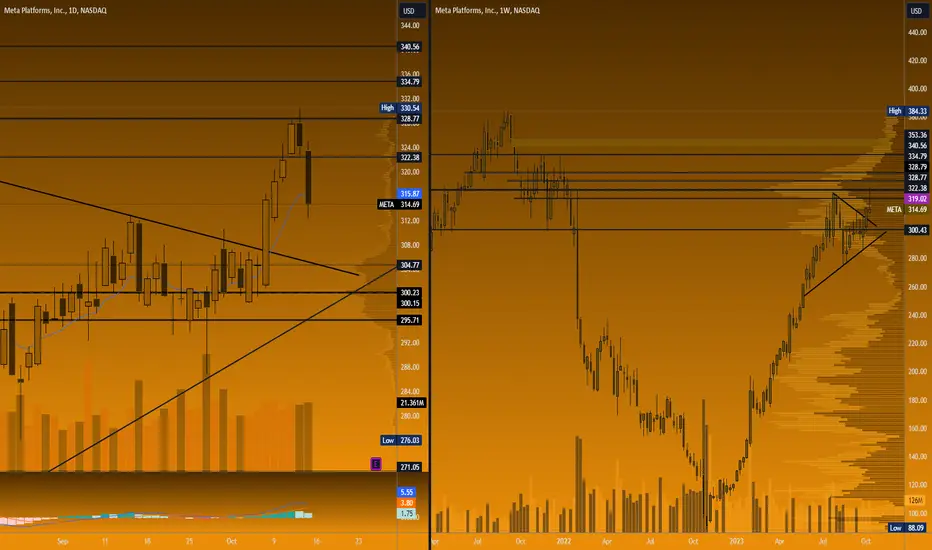
Opening Summary: Bullish breakout stalled at a key resistance level.
Market Structure:
- Currently in Markup, signaling bullish trend continuation.
Key Price Levels:
- Support: $300, $304.79, $309.32, $311.7
- Resistance: $325.88, $328.79, $334.79, $340.56, $353.36
Chart Patterns:
- Day: 2-2-2d reversal
- Week: 3-2-2u continuation, bullish flag breakout, inverse hammer
- Month: 2-1-2u reversal, bullish flag pattern
- Quarter: 2-2-2u continuation
Volume Analysis:
- Day: Bearish volume confirms the 2-2-2d reversal.
- Week: Bullish volume supports the 3-2-2u continuation.
- Month: Volume data not conclusive.
- Quarter: Bullish volume strengthens the quarterly 2-2-2u pattern.
Overall Outlook:
- If bearish sentiment continues, a retracement to $300 PL is likely.
Note:
- Back-testing shows an inverse hammer typically leads to a gap up or gap down.
Tracking chart Setups like meteorologist track Storms.
Disclaimer
The information and publications are not meant to be, and do not constitute, financial, investment, trading, or other types of advice or recommendations supplied or endorsed by TradingView. Read more in the Terms of Use.
Tracking chart Setups like meteorologist track Storms.
Disclaimer
The information and publications are not meant to be, and do not constitute, financial, investment, trading, or other types of advice or recommendations supplied or endorsed by TradingView. Read more in the Terms of Use.
