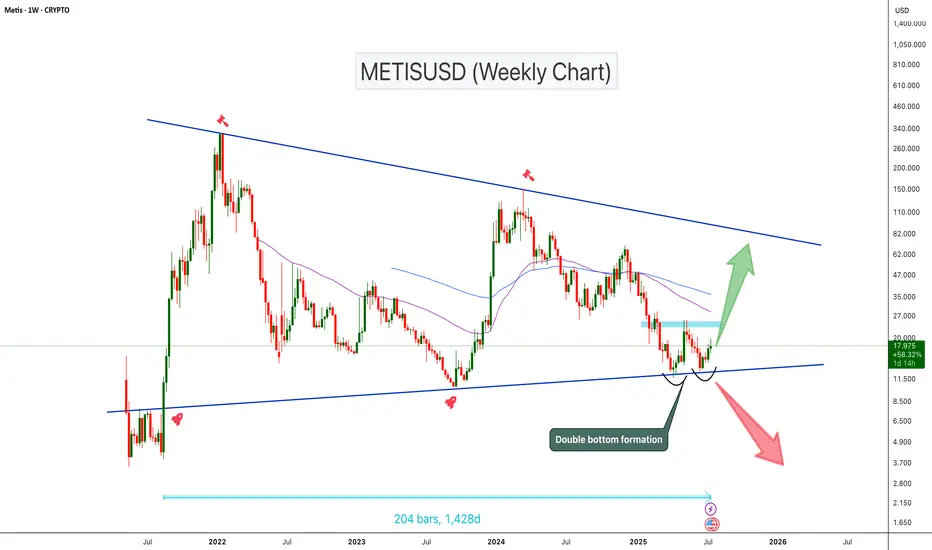
METISUSD has been trading inside a symmetrical triangle for the past 1,400 days. The price is currently sitting at the triangle support and forming a potential double bottom pattern. The double bottom can be confirmed once the price breaks the neckline resistance zone. If the price breaks this key resistance zone, we could expect a 100%–250% bullish move toward the triangle’s upper resistance
Cheers
Hexa🧘♀️

 METISUSDT MMETIS
Cheers
Hexa🧘♀️
🚀Telegram : t.me/hexatrades
🌐Website: hexatrades.io/
🗣️Twitter(X): twitter.com/HexaTrades
🌐Website: hexatrades.io/
🗣️Twitter(X): twitter.com/HexaTrades
Related publications
Disclaimer
The information and publications are not meant to be, and do not constitute, financial, investment, trading, or other types of advice or recommendations supplied or endorsed by TradingView. Read more in the Terms of Use.