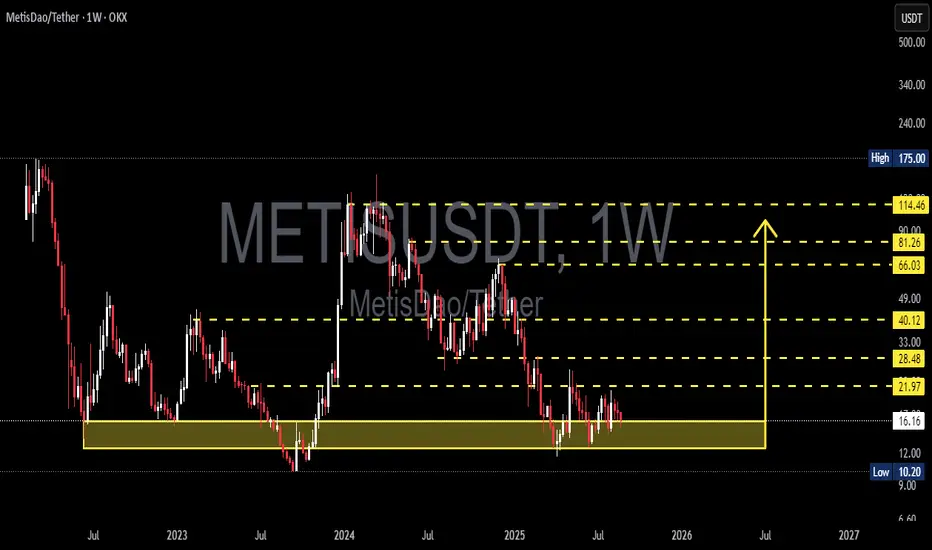
Currently, METIS/USDT is trading inside a very crucial demand zone at $10.20 – $16.16 (highlighted in yellow). This area has acted as strong support multiple times since 2022–2025, preventing deeper sell-offs. In other words, this is the last line of defense for buyers and a potential accumulation zone before a major move.
---
🔎 Technical Structure & Pattern
Macro trend: Since the 2024 peak, METIS has been forming a series of lower highs, signaling that the medium-term downtrend is still intact.
Key zone: The $10–16 range is a historical demand zone where buyers have consistently stepped in. Holding above this area increases the probability of a trend reversal.
Current formation: Price action shows a sideways movement within this demand zone → often referred to as a base-building phase or accumulation phase. Historically, such phases are followed by explosive moves either upward or downward.
---
🚀 Bullish Scenarios
1. Rebound from demand zone
If METIS holds above $10.20–$16.16 and prints a strong bullish weekly candle, a rally could begin.
Short-term upside targets: $21.97 → $28.48 → $40.12 (weekly resistances).
2. Medium-term reversal
A true reversal becomes more likely once price breaks and closes weekly above $40.12.
If confirmed, higher targets could unfold: $66.03 → $81.26 → $114.46.
This would mark the transition from lower highs to higher highs — a signal of a new bullish cycle.
---
🔻 Bearish Scenarios
1. Breakdown of demand zone
If price fails to hold and weekly closes below $10.20, the structure breaks down.
This opens the door for deeper declines, potentially towards $7–8 psychological levels.
2. False rally / rejection
If price rallies to $21–28 but gets rejected with strong bearish weekly candles, it would suggest weak buyers.
In that case, price could revisit the demand zone, keeping the downtrend intact.
---
🎯 Key Takeaways
The $10–16 zone is the most critical area on this chart → both a last defense for bulls and a potential golden accumulation zone for long-term positions (with strict risk management).
Bullish confirmation: A weekly close above $21.97 – $40.12.
Bearish confirmation: A weekly close below $10.20 → signaling a full breakdown.
---
📌 Important Note
Trading around such critical zones requires patience and confirmation. Avoid chasing moves blindly — wait for weekly candle confirmations (breakouts or breakdowns). Remember: accumulation phases can last longer than expected before a big move unfolds.
#METIS #METISUSDT #CryptoAnalysis #Altcoin #TechnicalAnalysis #PriceAction #SupportResistance #SwingTrading #CryptoMarket
---
🔎 Technical Structure & Pattern
Macro trend: Since the 2024 peak, METIS has been forming a series of lower highs, signaling that the medium-term downtrend is still intact.
Key zone: The $10–16 range is a historical demand zone where buyers have consistently stepped in. Holding above this area increases the probability of a trend reversal.
Current formation: Price action shows a sideways movement within this demand zone → often referred to as a base-building phase or accumulation phase. Historically, such phases are followed by explosive moves either upward or downward.
---
🚀 Bullish Scenarios
1. Rebound from demand zone
If METIS holds above $10.20–$16.16 and prints a strong bullish weekly candle, a rally could begin.
Short-term upside targets: $21.97 → $28.48 → $40.12 (weekly resistances).
2. Medium-term reversal
A true reversal becomes more likely once price breaks and closes weekly above $40.12.
If confirmed, higher targets could unfold: $66.03 → $81.26 → $114.46.
This would mark the transition from lower highs to higher highs — a signal of a new bullish cycle.
---
🔻 Bearish Scenarios
1. Breakdown of demand zone
If price fails to hold and weekly closes below $10.20, the structure breaks down.
This opens the door for deeper declines, potentially towards $7–8 psychological levels.
2. False rally / rejection
If price rallies to $21–28 but gets rejected with strong bearish weekly candles, it would suggest weak buyers.
In that case, price could revisit the demand zone, keeping the downtrend intact.
---
🎯 Key Takeaways
The $10–16 zone is the most critical area on this chart → both a last defense for bulls and a potential golden accumulation zone for long-term positions (with strict risk management).
Bullish confirmation: A weekly close above $21.97 – $40.12.
Bearish confirmation: A weekly close below $10.20 → signaling a full breakdown.
---
📌 Important Note
Trading around such critical zones requires patience and confirmation. Avoid chasing moves blindly — wait for weekly candle confirmations (breakouts or breakdowns). Remember: accumulation phases can last longer than expected before a big move unfolds.
#METIS #METISUSDT #CryptoAnalysis #Altcoin #TechnicalAnalysis #PriceAction #SupportResistance #SwingTrading #CryptoMarket
✅ Get Free Signals! Join Our Telegram Channel Here: t.me/TheCryptoNuclear
✅ Twitter: twitter.com/crypto_nuclear
✅ Join Bybit : partner.bybit.com/b/nuclearvip
✅ Benefits : Lifetime Trading Fee Discount -50%
✅ Twitter: twitter.com/crypto_nuclear
✅ Join Bybit : partner.bybit.com/b/nuclearvip
✅ Benefits : Lifetime Trading Fee Discount -50%
Disclaimer
The information and publications are not meant to be, and do not constitute, financial, investment, trading, or other types of advice or recommendations supplied or endorsed by TradingView. Read more in the Terms of Use.