Mew chart.
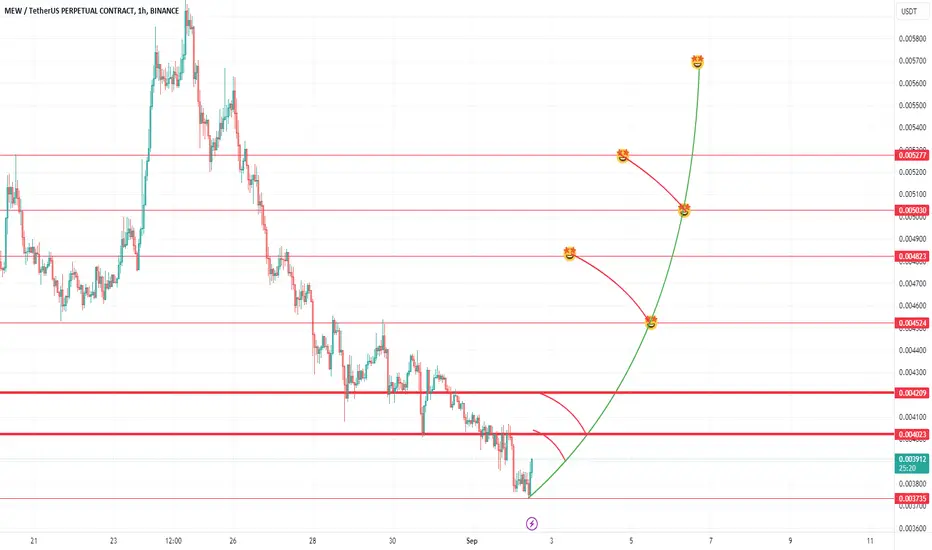
All lines are support and resistance with the main resistance lines the red thick ones at the bottom - those represent breakout resistance.
The smiley faces price targets.
Arch going up is bullish trendline. Once that is broken price will go to new lows
All lines are support and resistance with the main resistance lines the red thick ones at the bottom - those represent breakout resistance.
The smiley faces price targets.
Arch going up is bullish trendline. Once that is broken price will go to new lows
Disclaimer
The information and publications are not meant to be, and do not constitute, financial, investment, trading, or other types of advice or recommendations supplied or endorsed by TradingView. Read more in the Terms of Use.
Disclaimer
The information and publications are not meant to be, and do not constitute, financial, investment, trading, or other types of advice or recommendations supplied or endorsed by TradingView. Read more in the Terms of Use.