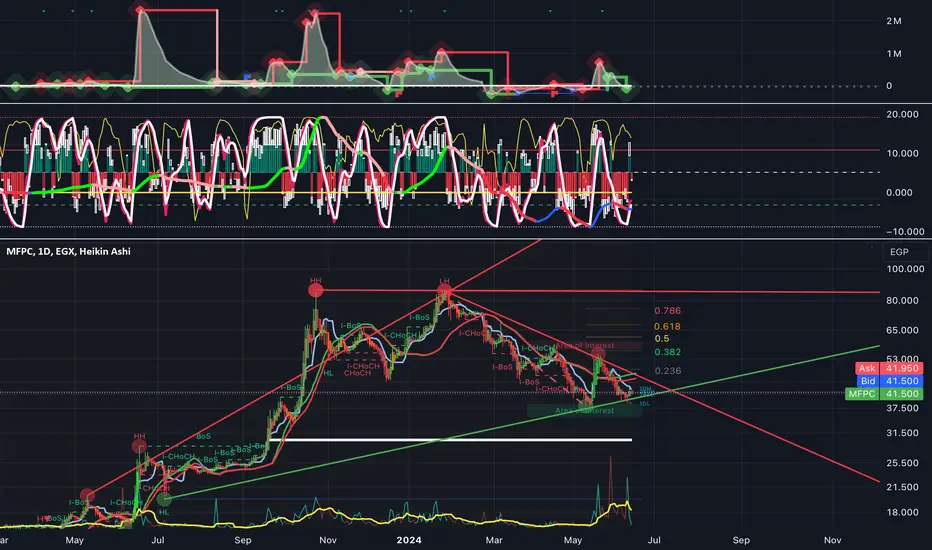
The MFPC stock chart presents a detailed technical analysis using various indicators and overlays. The Volume Price Trend (VPT) indicator at the top shows cumulative volume adjusted for price changes, revealing significant buying and selling pressure through its peaks and troughs. The Efforts vs. Results indicator below highlights the relationship between volume and price movements, where oscillations and crossovers can signal potential reversals or trend continuations.
The main price chart, which uses Heikin Ashi candles, smooths out price action to make trends more apparent. Green lines indicate rising trends, while red lines denote downtrends. The stock is currently trading at 41.870 EGP, reflecting a slight decline of 1.19%. The chart also includes a Moving Average (MA 9) for short-term trend identification and a volume line indicating the traded volume during each period.
Annotated on the chart are key price levels and patterns, such as Higher Highs (HH) and Lower Highs (LH), which signal trend reversals. Labels like Break of Structure (BoS) and Change of Character (CHoCH) mark significant shifts in market structure. Fibonacci retracement levels (0.236, 0.382, 0.5, 0.618, 0.786) are drawn to identify potential support and resistance levels.
Outlook for Tomorrow
For tomorrow’s trading session, the immediate outlook for MFPC stock suggests cautious optimism. The stock is near a key support level around 41 EGP, which it has tested and held multiple times. If the support level continues to hold and the volume increases, there could be a potential reversal or a bounce-back. Traders should watch for a break above the 43 EGP level, which would indicate the beginning of a recovery phase. Conversely, if the stock breaks below 41 EGP with increased selling volume, further declines could be expected, with the next support level possibly around 38 EGP.
Advice for Investors Who Bought Around 50 EGP
Investors who bought MFPC around 50 EGP are currently facing a significant unrealized loss. For these investors, the key is to closely monitor the support and resistance levels mentioned. If the stock begins to show signs of recovery and breaks above 43 EGP, it might be worth holding on to the stock for a potential further recovery. However, if the downward trend continues and the stock breaks below 41 EGP, investors might consider setting stop-loss orders to limit further losses. Long-term investors should also consider the company’s fundamentals and any upcoming news or earnings reports that could impact the stock’s performance.
In summary, while the MFPC stock is in a downtrend, the support at 41 EGP and volume trends provide a glimmer of hope for a reversal. Tomorrow’s session could be crucial, and investors should stay vigilant, particularly those who bought at higher levels around 50 EGP.
لو عايز تبقى واحد من اللي بيفهموا في الدهب وبيكسبوا من السوق صح،
🎯 للدهب والفرص الحقيقية تابعنا من هنا:
For gold updates & smart trades 👇
t.me/GOLDontheNILE
You're welcome to join my Telegram channel
انضم وابقى من اللعيبة مش من الجمهور💰🔥
🎯 للدهب والفرص الحقيقية تابعنا من هنا:
For gold updates & smart trades 👇
t.me/GOLDontheNILE
You're welcome to join my Telegram channel
انضم وابقى من اللعيبة مش من الجمهور💰🔥
Related publications
Disclaimer
The information and publications are not meant to be, and do not constitute, financial, investment, trading, or other types of advice or recommendations supplied or endorsed by TradingView. Read more in the Terms of Use.