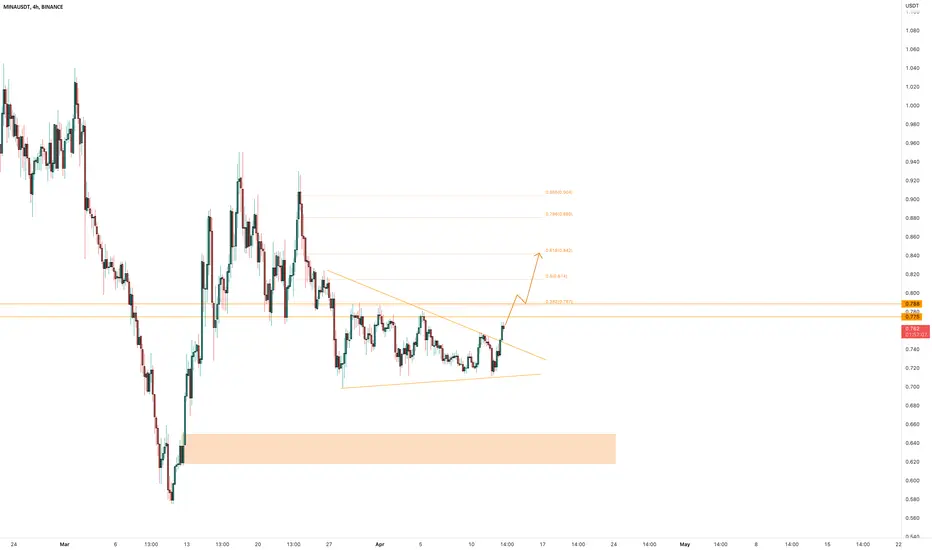
A triangle pattern is a technical chart pattern formed by drawing two converging trendlines connecting a series of lower highs and higher lows. The pattern can be symmetrical, ascending, or descending. Typically, the triangle pattern is characterized by decreasing trading volume and volatility as the price moves closer to the tip of the triangle. A clear breakout from the triangle pattern with significant volumes can be a strong indication of the direction of the next price move.
According to Plancton's Rules, if the price of
Note
10% Disclaimer
The information and publications are not meant to be, and do not constitute, financial, investment, trading, or other types of advice or recommendations supplied or endorsed by TradingView. Read more in the Terms of Use.
Disclaimer
The information and publications are not meant to be, and do not constitute, financial, investment, trading, or other types of advice or recommendations supplied or endorsed by TradingView. Read more in the Terms of Use.