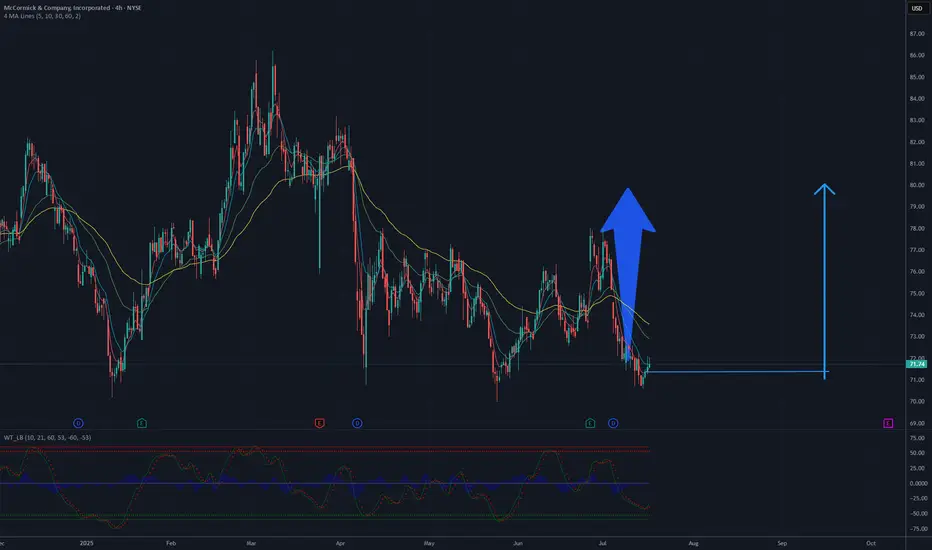
The chart analysis for this stock suggests a potential rise to 80 USD based on current technical patterns. The 4-hour chart shows a recent downtrend following a significant peak, with the price currently hovering around 71-72 USD. A key support level is evident near 70 USD, which could serve as a foundation for a potential rebound. The moving averages, including the 50-day and 200-day, indicate a prior bullish trend, and the current consolidation phase might precede another upward move.
Breaking through the resistance at 75-76 USD, a previous high, could signal the start of a new upward trend. With increased buying volume and bullish candlestick patterns, the price could target 80 USD, a notable psychological and technical resistance level. The RSI, currently in a neutral zone, could support this scenario if it begins to rise, indicating growing momentum. However, caution is advised, as a break below 70 USD support could negate this outlook and lead to further declines.
Potential TP: 80 USD
Disclaimer
The information and publications are not meant to be, and do not constitute, financial, investment, trading, or other types of advice or recommendations supplied or endorsed by TradingView. Read more in the Terms of Use.
Disclaimer
The information and publications are not meant to be, and do not constitute, financial, investment, trading, or other types of advice or recommendations supplied or endorsed by TradingView. Read more in the Terms of Use.