Understanding the Bullish Area on MMM
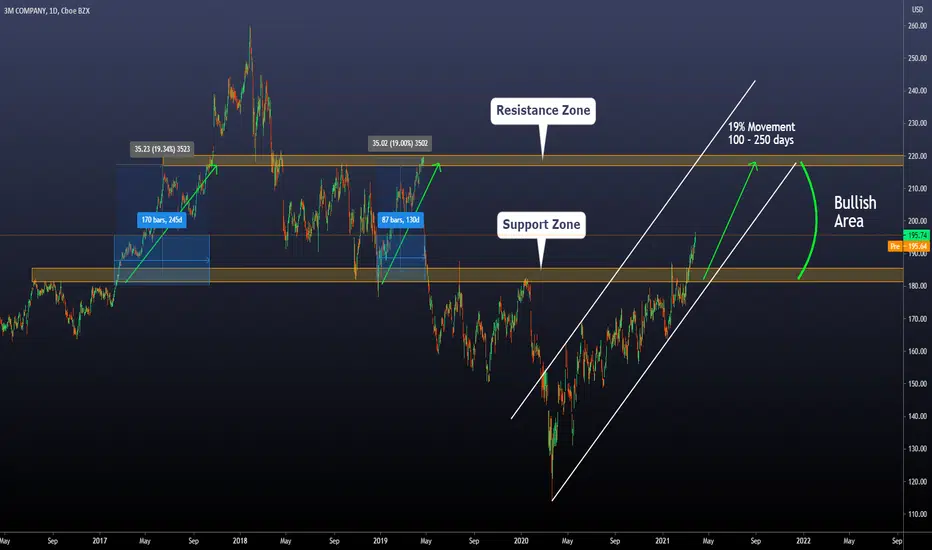
- On MMM, the price has broken a key resistance zone (now working as support), and we want to find similarities to previous situations to project possible scenarios.
- We can see that every time the price either bounce on the zone or broke it from below, we had a bullish movement towards the next resistance zone.
- The % we expect from the beginning of the movement is 19%. The expected duration of the movement is between 100 and 250 days
- During the movement, we can expect corrections to provide good entry levels to catch some % of the 19% expected movement.
Thanks for reading!
Disclaimer
The information and publications are not meant to be, and do not constitute, financial, investment, trading, or other types of advice or recommendations supplied or endorsed by TradingView. Read more in the Terms of Use.
Disclaimer
The information and publications are not meant to be, and do not constitute, financial, investment, trading, or other types of advice or recommendations supplied or endorsed by TradingView. Read more in the Terms of Use.