Japan’s economy defied expectations in Q2 2025. Exports roared back as a key driver, powered by a new U.S. trade deal and a weaker yen, sending the Nikkei higher. However, with tariffs and a cooling investment outlook on the horizon, the question is whether this upside has staying power.
Nikkei Rallies on Growth Surprise, Though BoJ Warns Boost May Fade
On 15/Aug, preliminary data showed that Japan’s economy expanded by 0.3% in Q2 2025, outpacing forecasts of 0.1% and building on the upwardly revised growth from the previous quarter.
Chart 1: Exports Drive Japan’s Q2 GDP Surprise, Economy Outpaces 0.1% Forecast

Source: Trading Economics (as of 18 Aug 2025)
The upside surprise was driven primarily by stronger exports, which contributed 0.3 percentage points to GDP after dragging growth by 0.8% in Q1.
Japan’s GDP growth beat expectations, offering a welcome surprise after a difficult second quarter marked by trade uncertainty. A breakthrough came on July 23, when Japan finalized a trade agreement with Washington that imposed a uniform 15% tariff on exports, including autos.
While the tariff reprieve on autos is significant, it is not the sole driver of recent momentum. The yen’s weakness has also supported Japanese exporters, as overseas earnings translate into higher profits when converted back into local currency.
Chart 2: Nikkei Soars While Yen Stumbles Against the Dollar since 2024

The key question is whether the Nikkei’s latest rally has the strength to continue, or if near-term headwinds could slow it down.
Exports to the US saw a temporary boost from front-loading ahead of higher U.S. tariffs, followed by a pullback.
Chart 3: Tariff Fears Spark Export Rush Followed by Retreat

Source: Ministry of Finance (as of 18 Aug 2025)
Industrial output is set to dip near term from factory shutdowns and mounting pressure from weaker overseas demand.
Chart 4: Factory Shutdowns and Sluggish Demand Cloud June Output Rise

Source: Trading Economics (as of 18 Aug 2025)
Household spending is set to remain strained, as higher food prices and weaker bonuses from lower corporate profits are likely to weigh on consumption through the second half of the fiscal year.
Chart 5: Rising Food Costs and Weak Bonuses Squeeze Household Spending

Source: Trading Economics (as of 18 Aug 2025)
The BoJ has cautioned that the drag from tariffs is likely to weigh on corporate earnings. That backdrop argues for a more measured outlook. Adding to this, Marcel Theliant of Capital Economics noted that while GDP growth recently surprised on the upside, he sees momentum cooling ahead as investment eases and exports edge lower.
Technical Indicators
Chart 6: MACD Strengthens, But RSI Flashes Overbought Warning

Prices remain firmly supported above short-term MA, with bullish momentum strengthening as shown by MACD. However, the relative strength index signals overbought conditions, suggesting that while the uptrend is intact, the market may be vulnerable to a near-term pullback.
Chart 7: Bollinger Bands Hint at Rally Pause Despite Buyer Momentum

Bollinger Bands suggest the same. While the uptrend is intact and buyers are clearly driving prices higher, the rally may be overextended, leaving the market vulnerable to a near-term pullback or sideways consolidation.
Hypothetical Trade Setup
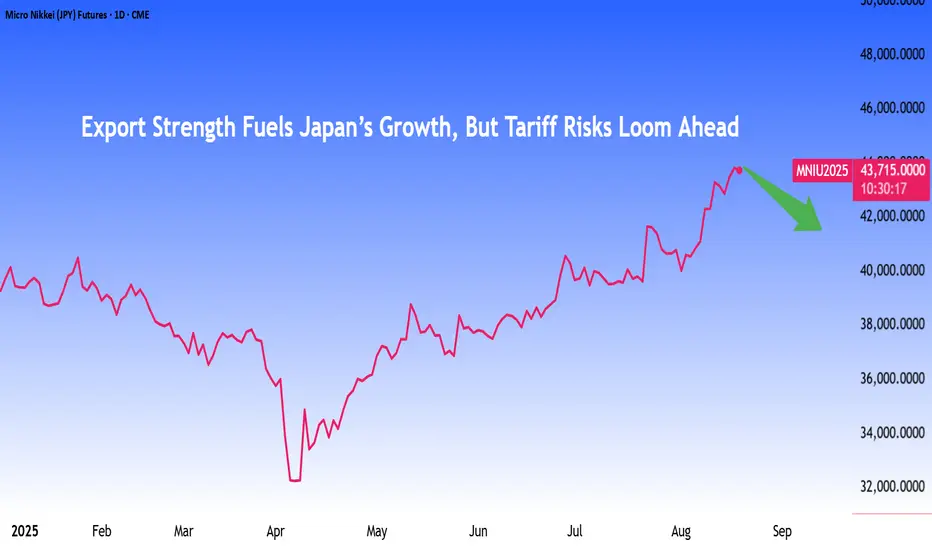
Chart 8: Hypothetical short position in CME Micro Nikkei 225 (Yen) futures expiring in September

Japan’s safe-haven status looks fragile, raising the risk of a pullback in the Nikkei 225. These factors support taking a short position in CME Micro Nikkei 225 (JPY) futures.
In this scenario, the yen-denominated Micro Nikkei Futures contract may boost USD-denominated returns, given the anticipated strengthening of the yen.
The investor should manage downside risk by placing a stop-loss. Based on Chart 8, one option is to set it just above 45,085, a potential resistance level, which would represent a maximum hypothetical loss of JPY 71,000 ((43,665 – 45,085) × 50 yen/contract). Investors with a lower risk tolerance may choose a closer stop-loss.
Hypothetical Short Position:
Entry: 43,665
Target: 41,540
Stop Loss: 45,085
Potential Gains: JPY 106,250 ((43,665-41,540) x 50 yen/contract)
Potential Losses: JPY 71,000 ((43,665-45,085) x 50 yen/contract)
Reward-to-Risk: 1.5x
MARKET DATA
CME Real-time Market Data helps identify trading set-ups and express market views better. If you have futures in your trading portfolio, you can check out on CME Group data plans available that suit your trading needs tradingview.com/cme.
DISCLAIMER
This case study is for educational purposes only and does not constitute investment recommendations or advice. Nor are they used to promote any specific products, or services.
Trading or investment ideas cited here are for illustration only, as an integral part of a case study to demonstrate the fundamental concepts in risk management or trading under the market scenarios being discussed. Please read the FULL DISCLAIMER the link to which is provided in our profile description.
Nikkei Rallies on Growth Surprise, Though BoJ Warns Boost May Fade
On 15/Aug, preliminary data showed that Japan’s economy expanded by 0.3% in Q2 2025, outpacing forecasts of 0.1% and building on the upwardly revised growth from the previous quarter.
Chart 1: Exports Drive Japan’s Q2 GDP Surprise, Economy Outpaces 0.1% Forecast
Source: Trading Economics (as of 18 Aug 2025)
The upside surprise was driven primarily by stronger exports, which contributed 0.3 percentage points to GDP after dragging growth by 0.8% in Q1.
Japan’s GDP growth beat expectations, offering a welcome surprise after a difficult second quarter marked by trade uncertainty. A breakthrough came on July 23, when Japan finalized a trade agreement with Washington that imposed a uniform 15% tariff on exports, including autos.
While the tariff reprieve on autos is significant, it is not the sole driver of recent momentum. The yen’s weakness has also supported Japanese exporters, as overseas earnings translate into higher profits when converted back into local currency.
Chart 2: Nikkei Soars While Yen Stumbles Against the Dollar since 2024
The key question is whether the Nikkei’s latest rally has the strength to continue, or if near-term headwinds could slow it down.
Exports to the US saw a temporary boost from front-loading ahead of higher U.S. tariffs, followed by a pullback.
Chart 3: Tariff Fears Spark Export Rush Followed by Retreat
Source: Ministry of Finance (as of 18 Aug 2025)
Industrial output is set to dip near term from factory shutdowns and mounting pressure from weaker overseas demand.
Chart 4: Factory Shutdowns and Sluggish Demand Cloud June Output Rise
Source: Trading Economics (as of 18 Aug 2025)
Household spending is set to remain strained, as higher food prices and weaker bonuses from lower corporate profits are likely to weigh on consumption through the second half of the fiscal year.
Chart 5: Rising Food Costs and Weak Bonuses Squeeze Household Spending
Source: Trading Economics (as of 18 Aug 2025)
The BoJ has cautioned that the drag from tariffs is likely to weigh on corporate earnings. That backdrop argues for a more measured outlook. Adding to this, Marcel Theliant of Capital Economics noted that while GDP growth recently surprised on the upside, he sees momentum cooling ahead as investment eases and exports edge lower.
Technical Indicators
Chart 6: MACD Strengthens, But RSI Flashes Overbought Warning
Prices remain firmly supported above short-term MA, with bullish momentum strengthening as shown by MACD. However, the relative strength index signals overbought conditions, suggesting that while the uptrend is intact, the market may be vulnerable to a near-term pullback.
Chart 7: Bollinger Bands Hint at Rally Pause Despite Buyer Momentum
Bollinger Bands suggest the same. While the uptrend is intact and buyers are clearly driving prices higher, the rally may be overextended, leaving the market vulnerable to a near-term pullback or sideways consolidation.
Hypothetical Trade Setup
Chart 8: Hypothetical short position in CME Micro Nikkei 225 (Yen) futures expiring in September
Japan’s safe-haven status looks fragile, raising the risk of a pullback in the Nikkei 225. These factors support taking a short position in CME Micro Nikkei 225 (JPY) futures.
In this scenario, the yen-denominated Micro Nikkei Futures contract may boost USD-denominated returns, given the anticipated strengthening of the yen.
The investor should manage downside risk by placing a stop-loss. Based on Chart 8, one option is to set it just above 45,085, a potential resistance level, which would represent a maximum hypothetical loss of JPY 71,000 ((43,665 – 45,085) × 50 yen/contract). Investors with a lower risk tolerance may choose a closer stop-loss.
Hypothetical Short Position:
Entry: 43,665
Target: 41,540
Stop Loss: 45,085
Potential Gains: JPY 106,250 ((43,665-41,540) x 50 yen/contract)
Potential Losses: JPY 71,000 ((43,665-45,085) x 50 yen/contract)
Reward-to-Risk: 1.5x
MARKET DATA
CME Real-time Market Data helps identify trading set-ups and express market views better. If you have futures in your trading portfolio, you can check out on CME Group data plans available that suit your trading needs tradingview.com/cme.
DISCLAIMER
This case study is for educational purposes only and does not constitute investment recommendations or advice. Nor are they used to promote any specific products, or services.
Trading or investment ideas cited here are for illustration only, as an integral part of a case study to demonstrate the fundamental concepts in risk management or trading under the market scenarios being discussed. Please read the FULL DISCLAIMER the link to which is provided in our profile description.
Full Disclaimer - linktr.ee/mintfinance
Disclaimer
The information and publications are not meant to be, and do not constitute, financial, investment, trading, or other types of advice or recommendations supplied or endorsed by TradingView. Read more in the Terms of Use.
Full Disclaimer - linktr.ee/mintfinance
Disclaimer
The information and publications are not meant to be, and do not constitute, financial, investment, trading, or other types of advice or recommendations supplied or endorsed by TradingView. Read more in the Terms of Use.