CME: Micro E-Mini Nasdaq 100 Index Futures ($MNQ) #TheFuturesLeap #Microfutures
Investors have defied the Wall Street adage of “Sell in May and Go Away”.
The S&P 500 rose by 6.2% in May while the Nasdaq climbed 9.6%. Both indices notched their best monthly results since 2023. The Dow Jones gained 3.9% for the month. The S&P stood out as it recorded its best performance for the month of May since 1990.

Several favorable factors propelled May’s impressive stock index gains:
• Early-May employment data pointed to continued strength, raising risk appetite.
• A temporary U.S.-China tariff reduction for 90 days helped calm trade tensions.
• Robust earnings from Nvidia and Super Micro Computer fueled rally momentum.
Meanwhile, these unfavorable events also occurred in May:
• Moody’s downgraded the US sovereignty rating. By now, the US has lost its AAA ratings from all three major credit agencies.
• The 20-year Treasury bond auction received a cold shoulder in the bond market.
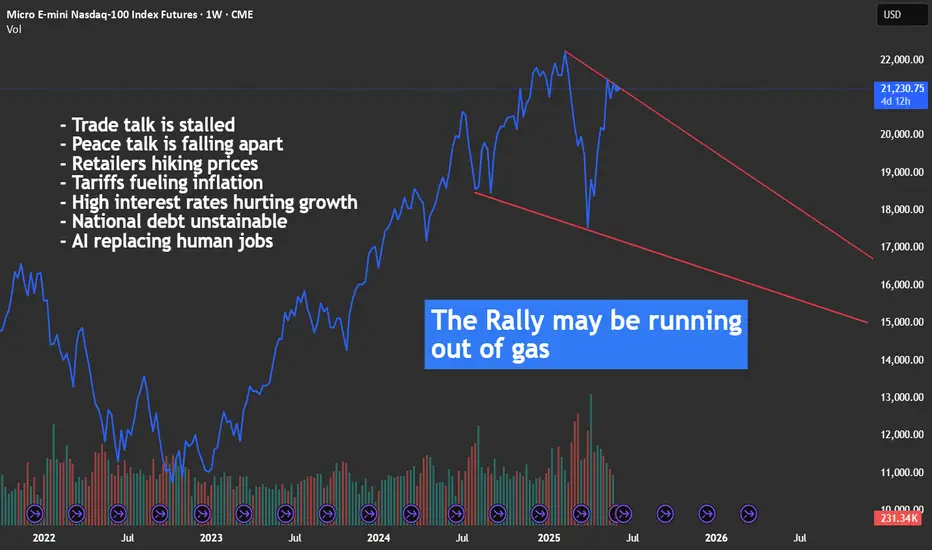
• The trade talk between U.S. and China has been stalled apparently.
In any other time, bad news of such significance would send the stock market into a free fall. But investors turned a blind eye to them. This highlighted a bullish market sentiment, a prevailing appetite for risky assets amid uncertainty in geopolitical and trade tensions.
Underpinning the rising stock prices are solid macroeconomic data for the month of April and strong Q1 earnings from major US corporations. Given that stock prices reflect expected future earnings, it is fair to ask: Will the data stay good?
Import dependency is unlikely to change any time soon
On May 30th, US Census Bureau reported that the U.S. trade deficit in goods narrowed sharply in April, with the gap contracted 46.0% to $87.6 billion. Goods imports decreased by $68.4 billion to $276.1 billion. Exports of goods increased by $6.3 billion to $188.5 billion.
What really happened is that there was a boost in imports in Q1 due to the front-running ahead of tariffs. This ended in April as the higher rates kicked in. If we take March out as an outliner, we will find that the April data is 9.7% higher than February. As a matter of fact, U.S. trade deficits in 2025 rose sharply comparing to 2023 and 2024 levels.
With the US-China interim trade deal in effect from May 14th, we could expect large waves of imports to resume from now through August, pushing trade deficits even higher.
The global supply chain is decades in the making. Its undoing will take years. Meanwhile, imports will pour in, only at higher costs due to the new tariffs and higher freight costs.
My conclusion: U.S. trade deficit will grow bigger, at least for the remainder of 2025.
Retail price hikes could cause inflation to rebound
US retailers largely source their products overseas. Could they just “eat the tariffs?”
• Walmart: FY2024 revenues $681 billion (+5.1% YoY). Net income jumped 25.3% to $19.4 billion, lifting its net profit margin to 2.9%.
• Target: Revenue $107.4b (-1.6%). Net income $4.14b (+49%). Profit margin 3.9%.
• Costco: Revenue $254.5b (+5.0%). Net income $7.37b (+17%). Profit margin 2.9%.
• Walgreens: Revenue $147.66 billion (+6.17%). Net Income -$8.64 billion (-5.9%)
• Amazon: Revenue $638.0b (+11%). Net income $59.2b (+95%). Profit margin 9.3%.

Apparently, even the largest and the most efficiently run retail giants are operating with a razor-thin margin. Retailers really have no choice but to pass on the tariffs to consumers, in the form of higher prices.
On May 15th, Walmart announced to raise prices starting in late April. The price hikes would accelerate in May, and a larger sting will start to be felt in June and July when the back-to-school shopping season goes into high gear.
Other retailers are expected to follow suit. Walmart’s action provides air cover for the tens of thousands of retailers to raise their prices freely.
My conclusion: Inflation will go up from May through the holiday season in December.
Higher interest cost will eat into the bottom line
While stock investors brushed off the Moody’s downgrade, the bond market has been in real trouble. As the US treasury bonds lost their “risk-free” status, debts of all kinds and all durations see a big spike in yield. Bond investors are undergoing a complete makeover of repricing bonds and reassigning a new “risk premium”.

On May 21st, the U.S. Treasury held an auction for 20-year bonds that fell significantly short of expectations. The lack of bidders—an alarming indicator of waning confidence in the U.S. economy—resulted in the yield on these bonds skyrocketing to 5.1%.
The bond yields go up even though the Fed holds rates steady. This indicates that central bank monetary policies are not very effective in shaping the long end of the bond market. Even if the Fed lowers the overnight Fed Funds rates, bond investors would still demand higher yield to compensate for the perceived risk increases for the once “risk-free” instruments. Commercial banks could keep interest rates high for mortgages, corporate bonds, auto loans and credit cards.
As of June 2nd, the futures market puts the odds of the Fed holding rates unchanged at 95.4% for its June 18th FOMC meeting, according to CME Group FedWatch tool.
cmegroup.com/markets/interest-rates/cme-fedwatch-tool.html
My conclusion: The Fed may have little appetite for cutting rates if inflation goes up. When they cut the overnight rates, businesses and households may not get any relief from high interest expenses.
Trade tensions and geopolitical risks may stay elevated
Before the ink dries on a temporary agreement, the trade talk between U.S. and China has been stalled. The minister-level negotiation has gone nowhere, and it may take presidential talk to salvage the agreement. At this point, we could not make any assumption about any trade agreement. Its shape and form and timing are uncertain. If the trade talk breaks down, we will see a new round of tariff reescalation and retaliation.
On June 2nd, breaking news report that Ukraine carried out a large drone attack deep into the Russian territory. Russian retaliation is expected. After months of effort, potential ceasefire and peace negotiation could fall apart.
My conclusion: Trade and geopolitical tensions are both escalating, after early signs of calming down. These would hurt economic growth and dent investor appetite for risk.
Trading with Micro E-Mini Nasdaq 100 Index Futures
Based on my analysis above, I hold the opinion that good data may quickly turn bad in the coming weeks, and correction in the US stock market is imminent. Valuation at the current lofty level completely ignores the risk escalation closer on to us. Anyone sharing this view could express it by shorting the CME Micro E-Mini Nasdaq 100 Index Futures.
The Micro Nasdaq contract has a notional value of $2 times the index. At the Friday closing price of 21,578, each September contract is worth $43,156. The minimum margin for shorting one contract is $3,036 at the time of this writing.
The latest CFTC Commitments of Traders report shows that, as of May 27th, the total open interest for Emini Nasdaq and Micro Nasdaq futures are 275,143 and 204,499 contracts, respectively.
• Leverage Fund has 77,467 in long, 251,452 in short, and 10,472 in spreading
• The long-short ratio of 1-to-3.2 (= 77467/251452) show that the “Smart Money” is very bearish on the Nasdaq while the index gained nearly 10% in May
Hypothetically, if Nasdaq 100 were to pull back 5% before September, a short futures position will gain $2,157.8 (= 21578 * 0.05 * 2).
The risk of shorting the Nasdaq is that the stock index continues to rally. To hedge the downside risk, the trader could set a stop-loss at his order. For example, a stop loss at 23,000 for a short order would set the maximum loss to $2,844 (= (23000-21578) x 2).
Happy Trading.
Disclaimers
*Trade ideas cited above are for illustration only, as an integral part of a case study to demonstrate the fundamental concepts in risk management under the market scenarios being discussed. They shall not be construed as investment recommendations or advice. Nor are they used to promote any specific products, or services.
CME Real-time Market Data help identify trading set-ups and express my market views. If you have futures in your trading portfolio, you can check out on CME Group data plans available that suit your trading needs tradingview.com/cme/
Investors have defied the Wall Street adage of “Sell in May and Go Away”.
The S&P 500 rose by 6.2% in May while the Nasdaq climbed 9.6%. Both indices notched their best monthly results since 2023. The Dow Jones gained 3.9% for the month. The S&P stood out as it recorded its best performance for the month of May since 1990.
Several favorable factors propelled May’s impressive stock index gains:
• Early-May employment data pointed to continued strength, raising risk appetite.
• A temporary U.S.-China tariff reduction for 90 days helped calm trade tensions.
• Robust earnings from Nvidia and Super Micro Computer fueled rally momentum.
Meanwhile, these unfavorable events also occurred in May:
• Moody’s downgraded the US sovereignty rating. By now, the US has lost its AAA ratings from all three major credit agencies.
• The 20-year Treasury bond auction received a cold shoulder in the bond market.
• The trade talk between U.S. and China has been stalled apparently.
In any other time, bad news of such significance would send the stock market into a free fall. But investors turned a blind eye to them. This highlighted a bullish market sentiment, a prevailing appetite for risky assets amid uncertainty in geopolitical and trade tensions.
Underpinning the rising stock prices are solid macroeconomic data for the month of April and strong Q1 earnings from major US corporations. Given that stock prices reflect expected future earnings, it is fair to ask: Will the data stay good?
Import dependency is unlikely to change any time soon
On May 30th, US Census Bureau reported that the U.S. trade deficit in goods narrowed sharply in April, with the gap contracted 46.0% to $87.6 billion. Goods imports decreased by $68.4 billion to $276.1 billion. Exports of goods increased by $6.3 billion to $188.5 billion.
What really happened is that there was a boost in imports in Q1 due to the front-running ahead of tariffs. This ended in April as the higher rates kicked in. If we take March out as an outliner, we will find that the April data is 9.7% higher than February. As a matter of fact, U.S. trade deficits in 2025 rose sharply comparing to 2023 and 2024 levels.
With the US-China interim trade deal in effect from May 14th, we could expect large waves of imports to resume from now through August, pushing trade deficits even higher.
The global supply chain is decades in the making. Its undoing will take years. Meanwhile, imports will pour in, only at higher costs due to the new tariffs and higher freight costs.
My conclusion: U.S. trade deficit will grow bigger, at least for the remainder of 2025.
Retail price hikes could cause inflation to rebound
US retailers largely source their products overseas. Could they just “eat the tariffs?”
• Walmart: FY2024 revenues $681 billion (+5.1% YoY). Net income jumped 25.3% to $19.4 billion, lifting its net profit margin to 2.9%.
• Target: Revenue $107.4b (-1.6%). Net income $4.14b (+49%). Profit margin 3.9%.
• Costco: Revenue $254.5b (+5.0%). Net income $7.37b (+17%). Profit margin 2.9%.
• Walgreens: Revenue $147.66 billion (+6.17%). Net Income -$8.64 billion (-5.9%)
• Amazon: Revenue $638.0b (+11%). Net income $59.2b (+95%). Profit margin 9.3%.
Apparently, even the largest and the most efficiently run retail giants are operating with a razor-thin margin. Retailers really have no choice but to pass on the tariffs to consumers, in the form of higher prices.
On May 15th, Walmart announced to raise prices starting in late April. The price hikes would accelerate in May, and a larger sting will start to be felt in June and July when the back-to-school shopping season goes into high gear.
Other retailers are expected to follow suit. Walmart’s action provides air cover for the tens of thousands of retailers to raise their prices freely.
My conclusion: Inflation will go up from May through the holiday season in December.
Higher interest cost will eat into the bottom line
While stock investors brushed off the Moody’s downgrade, the bond market has been in real trouble. As the US treasury bonds lost their “risk-free” status, debts of all kinds and all durations see a big spike in yield. Bond investors are undergoing a complete makeover of repricing bonds and reassigning a new “risk premium”.
On May 21st, the U.S. Treasury held an auction for 20-year bonds that fell significantly short of expectations. The lack of bidders—an alarming indicator of waning confidence in the U.S. economy—resulted in the yield on these bonds skyrocketing to 5.1%.
The bond yields go up even though the Fed holds rates steady. This indicates that central bank monetary policies are not very effective in shaping the long end of the bond market. Even if the Fed lowers the overnight Fed Funds rates, bond investors would still demand higher yield to compensate for the perceived risk increases for the once “risk-free” instruments. Commercial banks could keep interest rates high for mortgages, corporate bonds, auto loans and credit cards.
As of June 2nd, the futures market puts the odds of the Fed holding rates unchanged at 95.4% for its June 18th FOMC meeting, according to CME Group FedWatch tool.
cmegroup.com/markets/interest-rates/cme-fedwatch-tool.html
My conclusion: The Fed may have little appetite for cutting rates if inflation goes up. When they cut the overnight rates, businesses and households may not get any relief from high interest expenses.
Trade tensions and geopolitical risks may stay elevated
Before the ink dries on a temporary agreement, the trade talk between U.S. and China has been stalled. The minister-level negotiation has gone nowhere, and it may take presidential talk to salvage the agreement. At this point, we could not make any assumption about any trade agreement. Its shape and form and timing are uncertain. If the trade talk breaks down, we will see a new round of tariff reescalation and retaliation.
On June 2nd, breaking news report that Ukraine carried out a large drone attack deep into the Russian territory. Russian retaliation is expected. After months of effort, potential ceasefire and peace negotiation could fall apart.
My conclusion: Trade and geopolitical tensions are both escalating, after early signs of calming down. These would hurt economic growth and dent investor appetite for risk.
Trading with Micro E-Mini Nasdaq 100 Index Futures
Based on my analysis above, I hold the opinion that good data may quickly turn bad in the coming weeks, and correction in the US stock market is imminent. Valuation at the current lofty level completely ignores the risk escalation closer on to us. Anyone sharing this view could express it by shorting the CME Micro E-Mini Nasdaq 100 Index Futures.
The Micro Nasdaq contract has a notional value of $2 times the index. At the Friday closing price of 21,578, each September contract is worth $43,156. The minimum margin for shorting one contract is $3,036 at the time of this writing.
The latest CFTC Commitments of Traders report shows that, as of May 27th, the total open interest for Emini Nasdaq and Micro Nasdaq futures are 275,143 and 204,499 contracts, respectively.
• Leverage Fund has 77,467 in long, 251,452 in short, and 10,472 in spreading
• The long-short ratio of 1-to-3.2 (= 77467/251452) show that the “Smart Money” is very bearish on the Nasdaq while the index gained nearly 10% in May
Hypothetically, if Nasdaq 100 were to pull back 5% before September, a short futures position will gain $2,157.8 (= 21578 * 0.05 * 2).
The risk of shorting the Nasdaq is that the stock index continues to rally. To hedge the downside risk, the trader could set a stop-loss at his order. For example, a stop loss at 23,000 for a short order would set the maximum loss to $2,844 (= (23000-21578) x 2).
Happy Trading.
Disclaimers
*Trade ideas cited above are for illustration only, as an integral part of a case study to demonstrate the fundamental concepts in risk management under the market scenarios being discussed. They shall not be construed as investment recommendations or advice. Nor are they used to promote any specific products, or services.
CME Real-time Market Data help identify trading set-ups and express my market views. If you have futures in your trading portfolio, you can check out on CME Group data plans available that suit your trading needs tradingview.com/cme/
Jim W. Huang, CFA
jimwenhuang@gmail.com
cmegroup.com/markets/microsuite.html
jimwenhuang@gmail.com
cmegroup.com/markets/microsuite.html
Related publications
Disclaimer
The information and publications are not meant to be, and do not constitute, financial, investment, trading, or other types of advice or recommendations supplied or endorsed by TradingView. Read more in the Terms of Use.