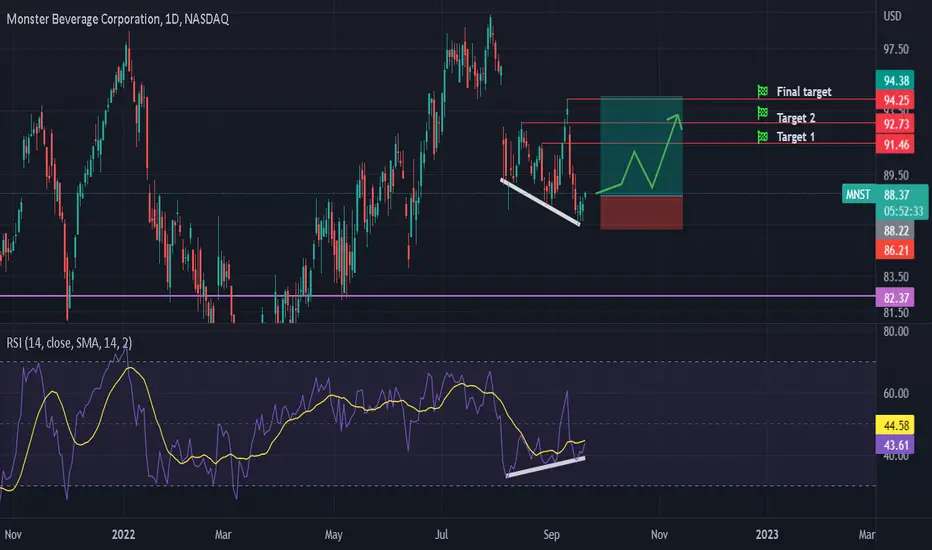
Looking at the chart we can see a bullish divergence pattern.
The price is going down while the RSI shows the opposite direction.
We expect for the price to go up and hit the targets.
The details are shown on the chart.
Goodluck
The price is going down while the RSI shows the opposite direction.
We expect for the price to go up and hit the targets.
The details are shown on the chart.
Goodluck
💥 Free signals and ideas ➡ t.me/vfinvestment
Disclaimer
The information and publications are not meant to be, and do not constitute, financial, investment, trading, or other types of advice or recommendations supplied or endorsed by TradingView. Read more in the Terms of Use.
💥 Free signals and ideas ➡ t.me/vfinvestment
Disclaimer
The information and publications are not meant to be, and do not constitute, financial, investment, trading, or other types of advice or recommendations supplied or endorsed by TradingView. Read more in the Terms of Use.