Long
Helium Mobile - (BULLISH) CASE
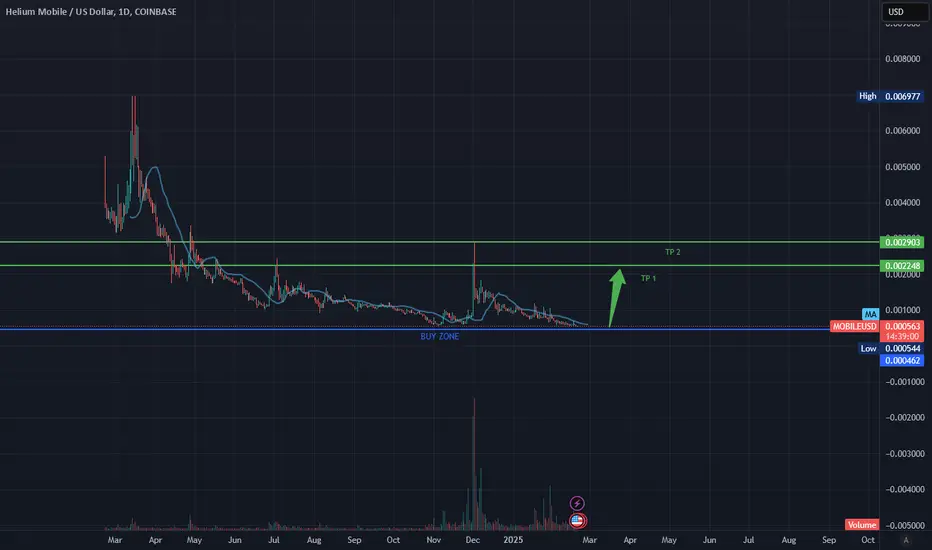
Chart Analysis:
Price Trend:
The price has been in a downtrend since its peak, with multiple lower highs and lower lows.
Currently, it seems to be at a strong support level, marked as the "BUY ZONE."
Support and Resistance Levels:
Support (BUY ZONE): Around $0.000454 - $0.000462, where the price has consolidated before.
Take Profit 1 (TP1): $0.002248 - 50% Take Profit
Take Profit 2 (TP2): $0.002903 - 25% Take Profit
25% Hodl for further gains
These levels suggest potential price targets for a bullish move.
Indicators:
A moving average (MA) is visible, which seems to be a short-term moving average acting as dynamic resistance.
Volume appears to be low but with occasional spikes, indicating possible accumulation.
Prediction & Possible Move:
The green arrow suggests a potential bullish move from the BUY ZONE towards TP1 and TP2.
The chart hints at a possible trend reversal if price holds above support.
Final Thoughts:
Bullish Case: If the price holds above support and volume increases, it may break out towards TP1 and TP2.
Bearish Case: If the support breaks, further downside could happen.
Recommendation: Watch for increased volume and confirmation of breakout before entering a trade.
Disclaimer
The information and publications are not meant to be, and do not constitute, financial, investment, trading, or other types of advice or recommendations supplied or endorsed by TradingView. Read more in the Terms of Use.
Disclaimer
The information and publications are not meant to be, and do not constitute, financial, investment, trading, or other types of advice or recommendations supplied or endorsed by TradingView. Read more in the Terms of Use.