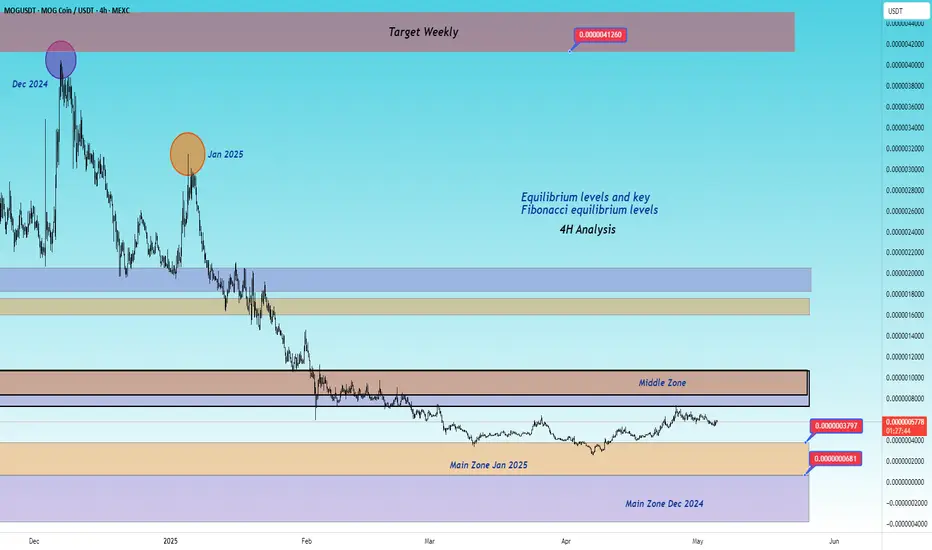
On the 4-hour chart of Mogcoin, equilibrium levels are marked from two highs of December 2024 and January 2025. As you can see on the chart, the recent reversal of Mogcoin price is due to entering the main zone of the January high and the market has not yet reached the downside of the main high in December... The equilibrium downside target of 0.000000068 will be touched to complete the equilibrium price cycle from the main highs....
In the long term and after completing the downward cycle, Mogcoin will reach the weekly bullish target of 0.0000041$.
Note: Equilibrium analyses look at the market on a large scale and macro scale and the targets may be delayed but will be touched...
In the long term and after completing the downward cycle, Mogcoin will reach the weekly bullish target of 0.0000041$.
Note: Equilibrium analyses look at the market on a large scale and macro scale and the targets may be delayed but will be touched...
Disclaimer
The information and publications are not meant to be, and do not constitute, financial, investment, trading, or other types of advice or recommendations supplied or endorsed by TradingView. Read more in the Terms of Use.
Disclaimer
The information and publications are not meant to be, and do not constitute, financial, investment, trading, or other types of advice or recommendations supplied or endorsed by TradingView. Read more in the Terms of Use.