Check out the price action in this chart!
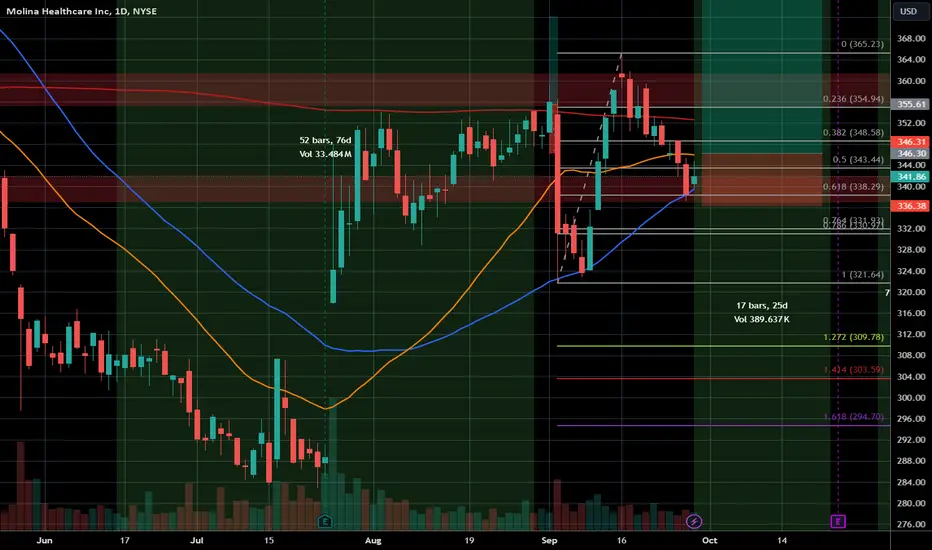
So, IF last day's high and the 30-day SMA [orange] are broken to the upside, I expect the next bullish impulse to begin.
- We’ve perfectly corrected the last upward impulse and landed at the 61.8% Fibonacci retracement.
- The price is supported by a horizontal support cluster [red].
- On the last trading day, the price tested the 50-day SMA [blue] precisely.
So, IF last day's high and the 30-day SMA [orange] are broken to the upside, I expect the next bullish impulse to begin.
Disclaimer
The information and publications are not meant to be, and do not constitute, financial, investment, trading, or other types of advice or recommendations supplied or endorsed by TradingView. Read more in the Terms of Use.
Disclaimer
The information and publications are not meant to be, and do not constitute, financial, investment, trading, or other types of advice or recommendations supplied or endorsed by TradingView. Read more in the Terms of Use.