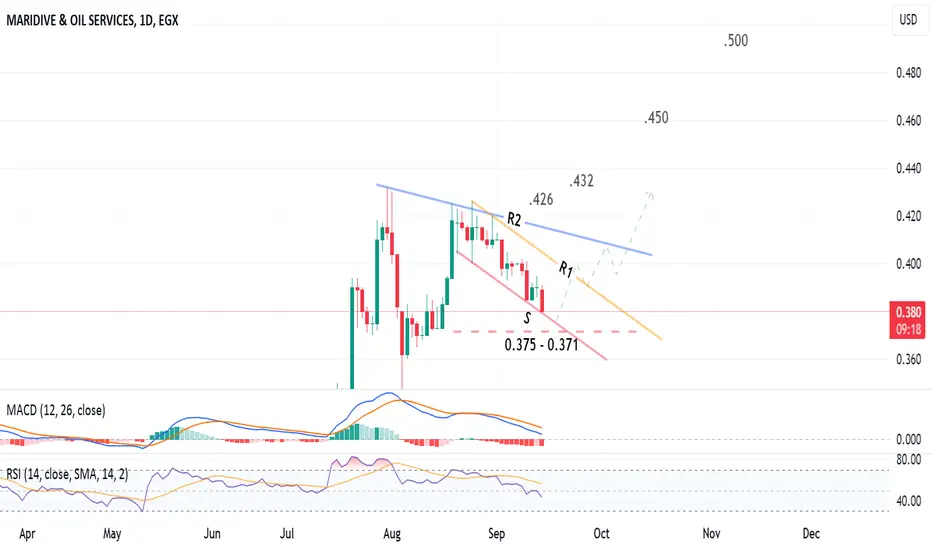
Daily chart, the stock  MOIL is trading in a flag chart pattern inside an expanding triangle.
I see the price has a high probability to rebound to resistance line R1 from the support zone 0.375 - 0.371, then the target will be blue line R2 (around 0.408 - 0.405)
Above R2, the targets are shown on chart.
Note: New entry should be after clear rebound.
Stop loss below 0.370 should be considered.
Disclaimer
The information and publications are not meant to be, and do not constitute, financial, investment, trading, or other types of advice or recommendations supplied or endorsed by TradingView. Read more in the Terms of Use.
Disclaimer
The information and publications are not meant to be, and do not constitute, financial, investment, trading, or other types of advice or recommendations supplied or endorsed by TradingView. Read more in the Terms of Use.