🔍 Pattern Identified: Falling Wedge – A Classic Bullish Reversal Setup
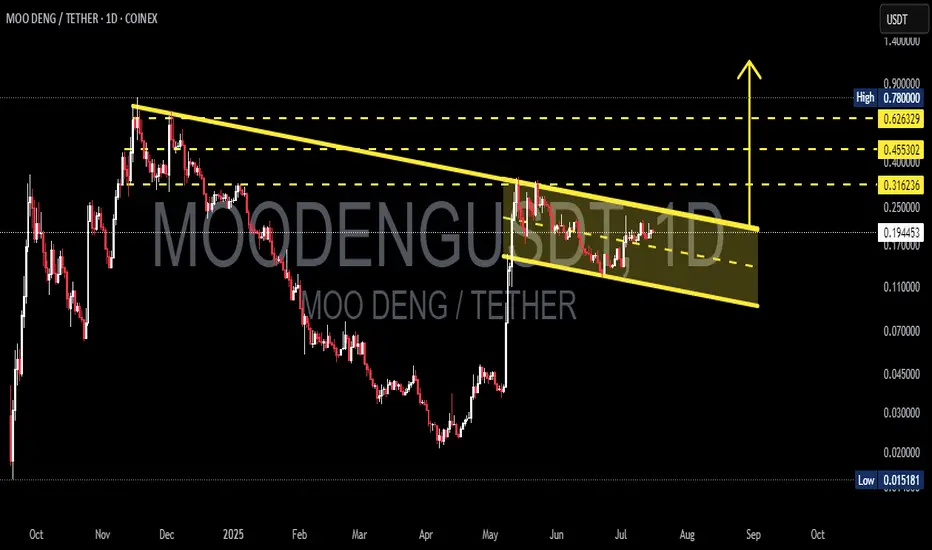
The MOODENG/USDT pair is currently forming a Falling Wedge pattern, a well-known structure that often appears at the end of a downtrend, signaling a potential bullish reversal.
Key characteristics of the Falling Wedge:
Down-sloping resistance and support lines converging toward each other.
Price action narrowing within the wedge as sellers weaken.
Often results in a powerful breakout to the upside, especially when accompanied by a volume surge.
📈 Bullish Scenario (Breakout Potential)
If the price successfully breaks out above the wedge resistance and closes above 0.25 USDT, this will confirm the breakout and open up potential upside targets:
🟡 Target 1: 0.316 USDT – Minor resistance zone and past consolidation level.
🟡 Target 2: 0.455 USDT – Major horizontal resistance and psychological level.
🟡 Target 3: 0.626 USDT – Golden Fibonacci zone and previous structure highs.
🟡 Ultimate Target: 0.78 – 0.90 USDT – The full wedge breakout projection and former top.
🔔 Ideal breakout confirmation includes:
A daily candle close above the wedge resistance.
Strong breakout volume.
RSI pushing above 60 and MACD crossing bullishly.
📉 Bearish Scenario (Breakdown Risk)
If the price fails to break out and instead falls below wedge support (especially under 0.17 USDT), it may revisit lower levels:
🔻 Support 1: 0.11 USDT – Historical bounce zone.
🔻 Support 2: 0.07 USDT – Last significant demand area before May’s breakout.
🔻 Final Support: 0.015 USDT – All-time low (high risk zone).
Still, current structure remains more bullish-biased as price consolidates near the upper wedge edge.
🧠 Market Sentiment & Narrative
This Falling Wedge is forming at the tail end of a long downtrend, with the asset showing early signs of accumulation.
If the broader crypto market sees renewed strength, altcoins like MOODENG could lead the next wave.
Smart traders spot these setups before the breakout — not after the crowd joins.
✅ Conclusion
This Falling Wedge is not just visually clean but strategically strong in terms of risk-to-reward. A confirmed breakout could trigger a massive rally with more than 200% upside potential from current levels.
Keep a close watch on the breakout level, volume confirmation, and daily candle structure. Patterns like this only appear a few times per market cycle — and they often mark the beginning of something big.
#MOODENG #AltcoinBreakout #FallingWedgePattern #CryptoAnalysis #USDT #TechnicalBreakout #ChartSetup #BullishAltcoins #CryptoReversal #TradingOpportunity
✅ Get Free Signals! Join Our Telegram Channel Here: t.me/TheCryptoNuclear
✅ Twitter: twitter.com/crypto_nuclear
✅ Join Bybit : partner.bybit.com/b/nuclearvip
✅ Benefits : Lifetime Trading Fee Discount -50%
✅ Twitter: twitter.com/crypto_nuclear
✅ Join Bybit : partner.bybit.com/b/nuclearvip
✅ Benefits : Lifetime Trading Fee Discount -50%
Disclaimer
The information and publications are not meant to be, and do not constitute, financial, investment, trading, or other types of advice or recommendations supplied or endorsed by TradingView. Read more in the Terms of Use.